Keys to implement inter-company billing and cross-charging using 360Eyes Full BI-on-BI tool
Without using a specialized software solution, how can you easily gather the data you need to implement inter-company or inter-project billing as part of your IT chargeback or showback policy? Implement inter-company billing and cross-charging using 360Eyes for SAP BusinessObjects, that’s how!
The IT services of one of our customers, a global oil and gas company, faced the challenge of needing to exercise inter-company billing for using SAP BusinessObjects. The rationale behind this move has been increasing costs of a complex and extensive deployment – not only for software and hardware, but also for manning multiple data centers and implementing a center of excellence. They decided to make business units responsible for SAP BusinessObjects resources usage, in a move to prevent them from asking for resources that are not going to be used if it comes out of their own budget. It also aimed to provide visibility to the business behind the costs of IT, as well as its critical role in facilitating educated decision-making.
Because the majority of this business’ reporting estate was fed from BW and BEX queries using BICS direct connectivity, they chose to track the number of BICS connections as a measure for utilization of the SAP BusinessObjects platform.
If, like our global customer, SAP BusinessObjects is one of the IT systems that gets cross-charged in your organization or is about to be, then it is important to understand the services you offer, as well as your costs.
Optimize the business value of SAP BusinessObjects
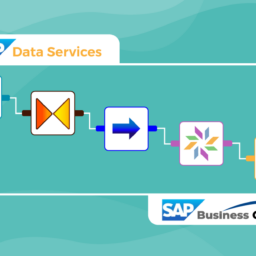
Part of 360Eyes focuses on extracting data from the SAP BusinessObjects CMS database, the Audit database, and the Filestore. This proves a distinct advantage as SAP BusinessObjects’ own access is limited to the CMS and Audit databases, separately. Data extraction from 360Eyes can be periodic and can be scheduled.
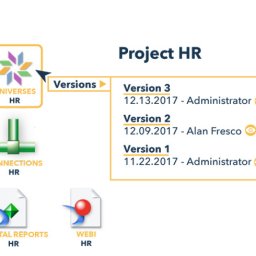
The other, value-adding part, is encapsulated in the 40 pre-canned reports that allow painting a complete picture of your SAP BusinessObjects landscape, to provide continuous analysis and control over it, including, but not limited to impact analysis due to decision-making changes, platform usage, licensing and security auditing.
Amongst these key benefits, there are reports particularly suited to chargeback and/or showback analysis. They can be used to determine the following metrics:
- Access to folders and applications
- The licensing landscape
- Resource usage levels
- Users and Groups
- Access and Security
- Number of installations
1. Monitor access to the folders and applications
The key aspect of IT chargeback and showback is knowing who has access to which resources, and what they do with it.
Some 360Eyes Webi reports come to mind to help answer that particular question.
Report 62 User actions list which lists all user actions on documents, such as create, refresh, modify, etc, and report 63 User activity which explicitly detects users with no action records for the last X days, as well as completely inactive users.
Report 07 User by last login date is equally useful as it displays all existing users ordered by last login date. Inactive users (Never connected) are also displayed. That way you can see who the biggest SAP BusinessObjects tools are.
2. Users and groups
Tying into the above user-centric reports, you can tie back to users to their rightful groups using report 17 User group membership to obtain an audit of all users and their group membership. This allows paint a broader picture and indicates that certain user groups in specific business units, let’s say Finance and Marketing, are the heaviest users of SAP BusinessObjects. As a result, they should foot some of the bill in its implementation and maintenance.
3. The licensing landscape
Some 360Eyes Webi reports are equally useful for determining the charging of day-to-day services (e.g., licenses, maintenance, etc.).
03 Recycle Licenses is one report that analyzes users to optimize license usage and cost. It highlights the proportion of inactive logins (never login), users who have not logged after X number of months, or having no action record in the last X months.
Report 81 Users over time offers an account of the evolution of the number of users over time, with the ability to filter on authentication type used.
Report 82 Deployed users licenses provides an action of the licenses system on the basis of per-user view or global view.
Report 83 Deployed user licenses through time showcases the evolution of licenses through time.
4. Resource usage levels
Frequency and intensity of SAP BusinessObjects tools usage can be tracked using a number of 360Eyes Webi reports, depending on the depth and breadth of analysis required.
Report 01 CMS provides an overview of system metrics: user login, instance count and size.
Report 04 Universes shows universe usage in terms of number of objects per universe, number of documents per universe, object to usage ratio per universe.
Report 42 Number of documents per universe details the number of documents using the different universes in the system.
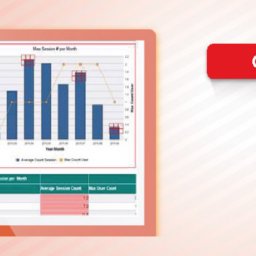
Report 20 Session Peak audits the maximum session count per month, session peak over a given time span, average number of sessions per session sampling duration.
Report 60 Document usage helps to identify unused document for a given period.
Report 61 Universe usage rate helps track universe usage in terms of number of actions, last action date, number of inactive days.
As you can see thus far, using 360Eyes, you can achieve the internal IT cross-charging benefits of greater control of costs and the implementation of software/license re-harvesting in a manner that is easy to maintain, repeatable, automated and auditable.
Let’s see what the other aspects for which you can glean information.
5. Access and Security
12 Unjustified Explicit Rights gives an account on non-justified rights, as a means to continuously monitor explicit user rights over universes, explicit user rights over folders, and explicit rights over documents. This is a powerful report useful for cleaning up rights if modifications to the SAP BusinessObjects security model needs to be aligned with the chargeback / showback policy. It can also be used for auditing that no user has rights over resource they shouldn’t.
Report 08 Right Details displays the fine rights (for example granular right ‘View objects’) for the selected user or group and objects. This way, you can check all documents a specific user or user group can view, and to check and review all users who are able to view a specific document.
Report 10 Folder Security Matrix provides an account of security across folders and principals, as defined in your SAP BusinessObjects security model.
By the same token, report 11 Universe Security Matrix provides an account of security across universes and principals, as defined in your SAP BusinessObjects security model.
6. Number of installations
Report 84 Server Information provides a simple report to gather the list of servers members on the cluster, the number of CPUs, key information, etc. This is useful when cross-charging is based on cost of ownership, number of installations, on top of the general usage levels.
The case for cross-charging using 360Eyes
The above review should give you insight into the type of information that can be extracted using 360Eyes as a means to help with laying the foundations for implementing chargeback and/or showback of your SAP BusinessObjects tools.
There is a multitude of scenarios where 360Eyes can be leveraged for Executive Reporting, Admin and we’ve found cross-charging is one of the more valuable, thus the tool’s appeal to our customers. You can do more with less, and achieve an even greater ROI without the need to incur additional costs for a third-party tool when you are already equipped with the deepest insight into Business Objects that you can obtain.