A Brief How-To Guide To SAP BusinessObjects Monitoring
SAP BusinessObjects growth and usage change dynamically on a daily basis, depending on the type and level of controls that are in place – if any! Over the course of my career working with SAP BusinessObjects, one of the pain points I found in terms of administration has been monitoring the platform.
Over the past few years, SAP has provided monitoring capabilities within the Central Management Console. However, I’ve found that setup and configuration have not been as straightforward as I would have liked. The load on the system has also been quite high due to additional processing on the SAP BusinessObjects Adaptive Processing Server (APS). SAP recommends that the monitoring service is hosted on a separate APS to avoid failures or poor performance of the APS. This led to monitoring being disabled most of the time to minimize the impact on already heavily utilized systems and enabled only to help troubleshoot issues as they appeared.
Understanding how an SAP BusinessObjects system works is important to its stability and performance. Being able to collect and monitor the key metrics over time of the entire SAP BusinessObjects system usage, including underlying systems is central to this task. That way informed decisions can be made to ensure optimal system performance, i.e. utilization, trend analysis, workload, and stability.
Monitoring is equally useful to make the right proposal when upgrading or migrating. Building a business case to justify the procurement of either physical hardware or virtualization platform is another pertinent reason. Monitoring capabilities come as standard in 360Suite since 360Live was released in 2016. Our developers decided to stay ahead of the pack and use HMTL5 instead of the resource-hungry Adobe Flash, whose support will end on December 31, 2020 (actually, patching to BI 4.2 SP08 or BI 4.3 will help solve this).
Like all 360Suite’ offerings, automating the monitoring process is central to the application. The solution can send out notifications when critical thresholds are met and can trigger actions in response. The solution doesn’t need to be installed on the SAP BusinessObjects environment it is monitoring. It can reside on its own server and it communicates to SAP BusinessObjects via its SDK.
SAP BusinessObjects Monitoring With 360Live
The steps below present a workflow that would work for most deployments:
1. Install 360Live
Install the full package which contains a Tomcat and JVM, a PostgreSQL and the 360Live. A wizard will guide you through the installation process. It is important that you have the SAP BusinessObjects application tier SDK libraries available (either from a full SAP BusinessObjects installation or by simply copy-pasting the folder on the server). This is a must, as our solutions use the SAP BusinessObjects API to communicate with the system in order to leverage the security model and to ensure licensing compliance with SAP.
A simple configuration step is required post-installation to hook up the 360Live application to the PostgreSQL database.
If you wish to consume 360Live metrics for SAP BusinessObjects’ operating system memory load and CPU load, then you must ensure the 360Probe agent is running on the physical server(s) running SAP BusinessObjects.
2. Set up initial monitoring
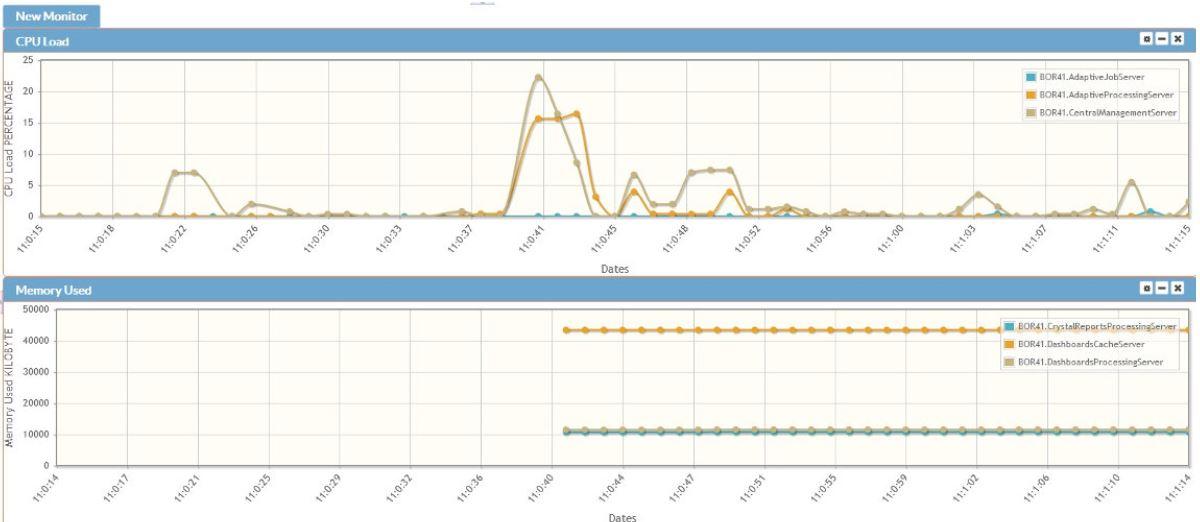
Create new monitors on mission-critical components to assess the current health of the system. You can create dashboards yourself that encompass multiple monitors so you have a saved view of some metrics you can consult on a regular basis. New monitors can also be added on the fly inside existing dashboards. Bear in mind that monitors display real-time measurements. As such, they don’t record values over time. For such a feature, use watchers instead; they allow you to record historical data and check trends over time.
The key services to monitor should include the following:
- CMS and Audit database
- Operating System
- CMS processes
- Input and Output File Repository Server
- Processing servers
- Long-running WebIs
3. Fix any Unhealthy Servers
Here are some suggestions to apply:
- Restart services if they are stale or have become unstable.
- Increase the Java -Xmx memory value of each Adaptive Processing Server or Adaptive Job Server.
- Increase the WebI Processing Server cache values.
- Disable logging if enabled by default.
In short, take any necessary remedial actions to make SAP BusinessObjects services healthy again. An advantage with 360Suite is that if your SAP BusinessObjects server did happen to go down, as our solutions are installed and run outside of Business Objects, we can keep monitoring it and alert you in case of a server crash.
4. Configure SMTP to Enable Email Notifications
Provide the necessary credentials to allow 360Live to send you e-mail alerts when user-defined conditions are met. This is the great thing about 360Live and the big differentiator from any other similar solution; when our solution sends out these notifications, it triggers actions in response so you continually monitor your SAP BusinessObjects platform.. For example, if your Business Objects services are stopped, we can let you know whereas SAP BusinessObjects wouldn’t be able to email you because their server is down.
5. Execute Your Actions
Whenever a trigger is reached, and if you’ve set-up your email alerts correctly, you will receive a notification. From there you will be in the position to execute tasks in response to the trigger.
For example:
- When a service is stopped or returns too many errors: Restart it
- In a active/passive cluster, if the requests are above a threshold: Start a Service
- If you are running out of disk space: Execute a script to clear temp files
This is an extremely helpful feature because it allows you to be proactive in monitoring your SAP BusinessObjects deployment.
6. Create and Schedule Watchers
I mentioned watchers before as metrics themselves can’t record their values over time but watchers can. They are special monitors that contain one or more user-defined rules that evaluate a service state. When that service state is met, it sends a notification and performs a preconfigured action.
This video walks through creating a watcher on the Adaptive Job Server that will send an email if the service goes down and that will automatically restart it:
The above KPIs are a good starting point to monitor day-to-day activities. With access to historical metrics, you can easily isolate the culprit in a faulty workflow and carry out troubleshooting and detailed analysis. Once you find bottlenecks and limitations, you can tune and scale the various parts of the SAP BusinessObjects system. You can increase CPU, RAM, service cache size, set a higher number of parallel queries, optimize query planning, add nodes, or distribute services better for failover and high availability.
Planning SAP BusinessObjects monitoring with 360Live for the long-run
In order to proactively monitor the health of your SAP BusinessObjects landscape, you can define some metrics worth watching over time, for example:
- CMS Availability: you can set up an alert to notify if the CMS is down, with the option of triggering a restart of the service as required.
- Operating System CPU and RAM consumption: check the current percentage of CPU time used by the process run by a specific SAP BusinessObjects service. For memory, you can view the current size of the working set (private and shareable) used by the process also run by a specific SAP BusinessObjects service.
- CMS Server: there is a plethora of metrics for the CMS metrics but the ones that are worth watching revolve around the number of sessions established, as it indicates consumption of either Named or Concurrent licenses as indicated in your keycode. Keep an eye as well on key performance indicators such as database connection metrics to ensure the CMS contains a large enough connection pool. Commit response times should also be checked as a duration greater than 10,000 milliseconds may indicate a need to tune the CMS service and/or its database.
- Input/Output File Repositories: you can monitor the growth and usage over time in regards to disk space usage and number of active files. Bear in mind that limiting the number of instances on scheduled jobs is the best strategy to optimize the Output FRS. A user request for an instance of a report will run slower when trying to find it amongst thousands of stored instances.
- Processing Servers: some metrics are specific to certain services, however there are common ones that are worth paying attention to such as: busy server threads that will indicate if the system can’t process additional requests in parallel, processing times that might point to a need for additional servers on the system, memory metrics to guarantee sufficient JVM allocation and disk space utilization.
- Auditing utilization: the current number of pending audit events could indicate either that the audit is not properly configured or that a heavily loaded system is generating audit events faster than the auditor can process them.
- Job statuses on the Job Server: you can check the number of job requests versus the number of failed job creations. A high failure rate will be indicative of an issue with the Job Server, such as lack of resources, a poorly sized service in terms of Java memory or even users over-utilizing scheduling as a means to refresh their documents. A high number of concurrent jobs will reflect how busy the server is.
- WebI Refresh Session: you can set a threshold for long-running WebIs so you are alerted when a document exceeds an expected duration. The alert will provide information such as the user, the document, which server and the type of action (On-Demand, Scheduled, Recurring). You can also see at any given time which WebI documents are running on the platform.

Once again, if you want to keep a history of data for an indicator, create a watcher.
Try SAP BusinessObjects Monitoring With 360Live For Yourself
Thanks to the 360Live monitors and watchers, implementing a robust SAP BusinessObjects monitoring strategy is quick, straight-forward and light-weight so you get a well-rounded view of your system. Like with all our solutions, our ultimate goal is to reconnect IT and the business. We want you to maintain a high performing, secure and available system. We want your users to be productive, self-sufficient and satisfied SAP BusinessObjects consumers.
So what are you waiting for? Don’t wait. Try 360Live Monitoring for yourself!


