The 22 Best WebI Innovations Across All SAP BusinessObjects BI 4.2 Versions
Turning excel data into meaningful visualizations is one of the best ways to analyze information and help understand underlying trends and root causes. In all Business Objects versions, Web Intelligence allows you to turn those mind-boggling excel spreadsheets into simple and logical diagrams. With its highly interactive and flexible data interface, users can view data from different perspectives and turn insights into clear business decisions.
Go Wild With WebI
We’ve gathered all the top innovations and hidden secrets within WebI by BI 4.2 Service Pack to make your life easier when working on your reports. Use these 22 innovations and everyone will want WebI reports just like yours!
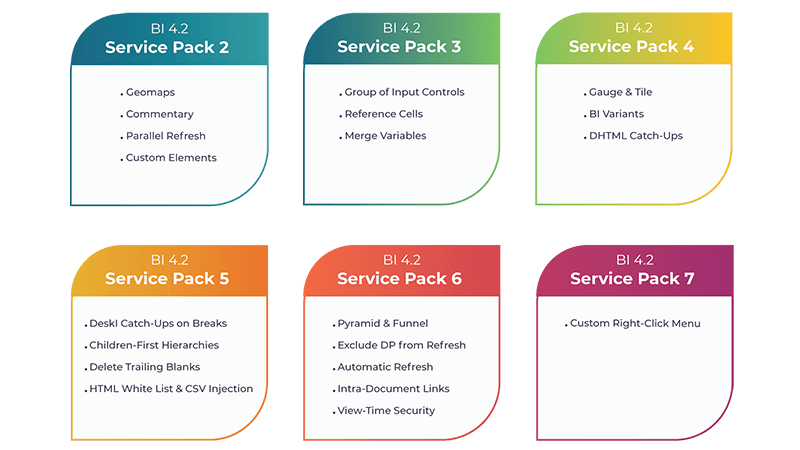
SAP BI 4.2 SP02
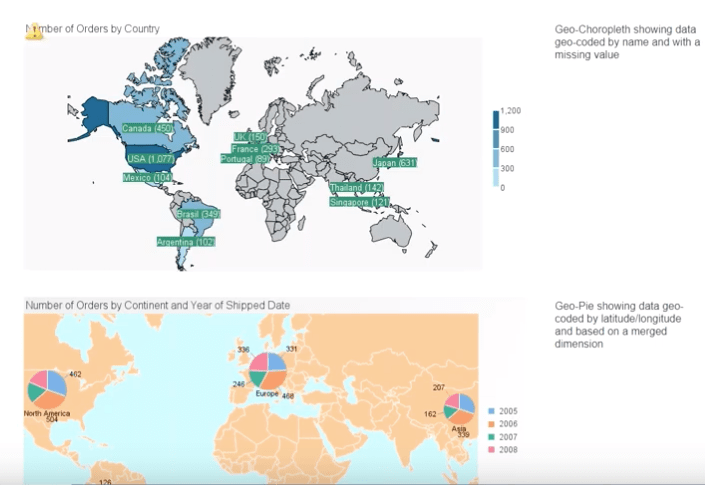
Geomaps
First available in the SP02 4.2 Business Objects version, WebI allows you to create 3 different types of Geomap visualizations: choropleth, pie and bubble. Colors of each visualization can be modified as well as the longitude/latitude so that you can show the most important information for you. If a warning sign appears, this is because not all the data is geo-qualified. For example, WebI wouldn’t be able to find the country Korea as it needs to be North or South Korea.
Commentary within a WebI document
This innovation allows you to add a commentary directly to your document, for example in a specific cell. You can reply to your comments and set specific comment authorization settings depending on who you want to access the comments or not.
Parallel Refresh
Reduce the time it takes to refresh your WebI document with the Parallel Refresh option. Sometimes you will want to refresh all your queries at the same time, in parallel and not one-by-one. This setting lets you refresh the queries in parallel. It works for all data providers and can be configured in the CMC.
Custom Elements
This is a third-party visualization service that you implement yourself. What WebI provides you with is an external API that allows you to get the visualization within your WebI document. You can then use it exactly like a WebI chart and edit it accordingly (rank, sort, hide, filter, etc). If you decide to refresh your data, the chart will automatically refresh as well. Just go into your CMC to configure this service.
SAP BI 4.2 SP03
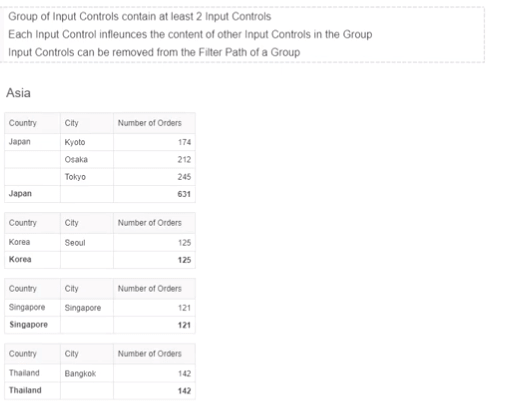
Group of Input Controls
Input Controls are sorts of cascading filters within a group. For example, a group is called “Geography” and the input controls would be the continent, country and city. If you change a value within a group then this will influence all the input controls of that group.
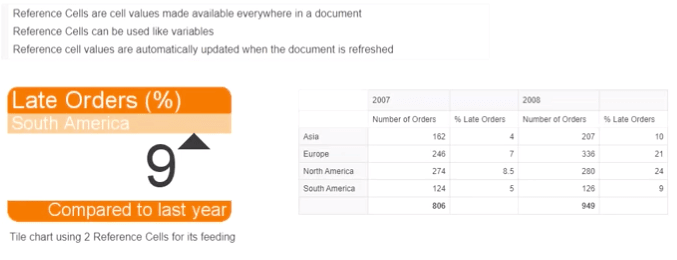
Reference Cells
An important feature not to miss! This allows you to pick a cell in a WebI table and make it as a reference that can be used with other calculations. In other words, you are highlighting a specific cell you want to showcase. For example, it allows you to compare one figure with another showing you also a percentage increase or decrease. One thing to note here is that if you update the values in your document, this will automatically change the reference cell values.
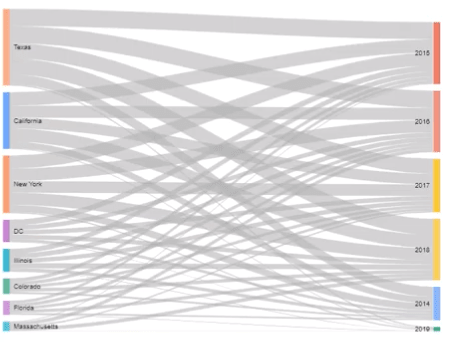
Merge Hierarchical
This innovation allows you to merge two hierarchical dimensions from two different queries into one, for example, combining the Parent and Children values.
SAP BI 4.2 SP04
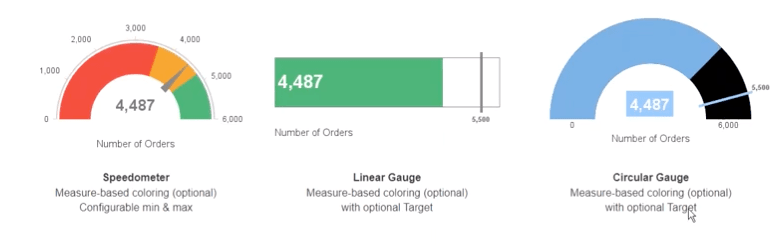
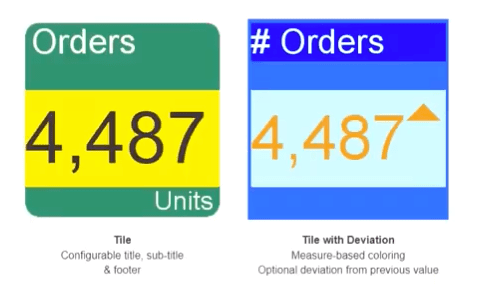
Gauges and Tiles
Three types of gauge visualizations are available starting in WebI SP04: Speedometer, Linear and Circular gauges. What is useful here is that they are very configurable; you can change the target, color, scale, and even decide whether the value appears or not.
Tiles can be used to display important KPIs in your document with very configurable charts. You can change the colors, title, add comments and even the ‘look’ of the tile. You can either create a straightforward tile or a deviation one. A deviation tile makes a comparison between values with the arrow pointing upwards or downwards depending on your data.
Prompt Variants
A prompt variant is a group of often-used variable value sets, and this particular WebI innovation is for all data sources type including SAP BW/HANA data source. For those of you using BW, you will know that you can have lots of variables translated into prompts in the WebI query panel, and when you refresh the document you will get all these prompts to answer, which can become very tedious. A helpful feature here is that you can create different variants with different prompt values. This feature is also available in a reading mode so any user can access it.
DHTML Catch-ups
This was the most requested feature by customers from the Business Objects version 4.2 SP03. These are the following new features available in WebI Intelligence DHTML:
- Support for excel data source
- Query panel for SAP BEx, UNX on SAP Bex data providers
- Complex filters in the query panel
- Conditional formatting
- Format number
- Change source
- Export as dialog box improvements
SAP BI 4.2 SP05
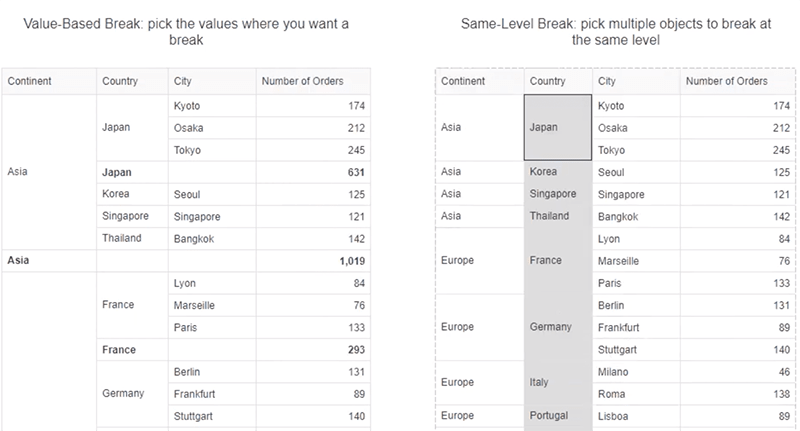
Deski Catch-ups on Breaks
There are two features to this WebI innovation. The first one is the ability to choose which value of a dimension to display as a table break. For example, for a country, a break would be the cities in that country. The second feature is the ability to show the break on the same level for two or more dimensions, so all cells can be aligned in your table of data.
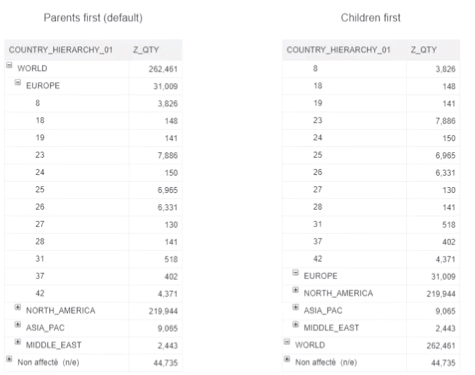
Children-First Hierarchies
The Children-First Hierarchy innovation allows you to change the order of hierarchies. To understand what these “Children” are, let’s take this following example:
World > Europe > Countries within Europe
These countries in Europe are what we call “Children”, and you can have the Children displayed first and World at the bottom. Either the Children or Parent can be displayed first and you can change this in the Settings.
Delete Trailing Blanks
A small but useful function that deletes all the blank characters at the end of each value in the query panel. This is particularly helpful when you have two similar values on separate rows in a table, and one of the values has an extra blank character at the end. Checking this box in the Properties tab will avoid this occurring.
HTML White List & Prevention of CSV injection
Your HTML White List is a list of all the allowed HTML tags and attributes, which you can edit as you wish. This function applies to the custom elements and also to the extension points (which is anything external to WebI).
The prevention of CSV injection adds a space character before @, +, -, or = to prevent the execution of malicious code when opening the CSV file in Microsoft Excel.
SAP BI 4.2 SP06
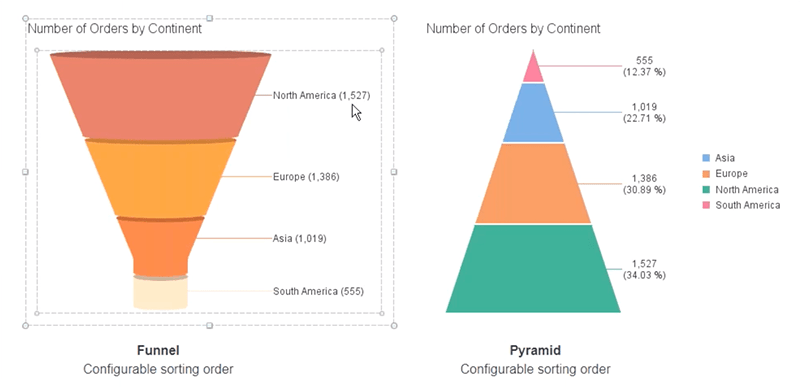
Pyramid and Funnel
Using the Pyramid and Funnel visualizations are another way of displaying your data, and can easily be modified in terms of the ranking of data and colors. The cane can also be displayed in 3D mode.
Exclude Data Provider From Refresh
If you are looking to gain extra time when refreshing queries then this WebI innovation is the one for you. Rather than having to refresh all queries even though not all have been changed, you can exclude the queries that do not need to be refreshed. All it takes is to uncheck the “Refreshable” box for a specific query.
Automatic Refresh
This functionality allows you to set-up an automatic refresh function in the BI Launchpad for a specific WebI document. You can enable it however you want, for example, a refresh every two minutes, and as long as this function is activated it will stay in this mode unless changed. You will also get a little reminder on your screen indicating when the document was last refreshed.
Intra-Document Links
To save you time from switching from one WebI report to another using the tabs, you can add hyperlinks within a document that points towards another WebI report, inside the same WebI document.
View-time Security
This security function allows you to only share pieces of data at the view time with certain users. Once you are in the IDT, you can select the users that you want to apply security options for (Business Security Profile). This is a good functionality if you want to hide information for certain users and gain additional performance at the refresh time, as the document can contain all the data, but will be restricted at the view time, based on the Business Security Profile applied to a user.
SAP BI 4.2 SP07
Custom right-click menu
The custom right-click menu allows you to customize the content of the contextual menu, per group of users. This is the menu that appears when you select an object and right-click on it. To customize this menu, you will need to go into the CMC and from there you will be able to decide what appears or does not appear for different groups of users.
Wrapping it up
The WebI innovations across the Business Objects versions don’t stop there! There are plenty of other functionalities that can help you get the most out of this data visualization platform — here are just the top 22 picked out by the WebI expert team.
If you need help in putting these innovations in place, take a look at our webinar dedicated to this or simply get in contact with us, and one of our experts will get you up and running.