
The Analytics Governance Market Landscape 2026: A Buyer’s Guide to an Emerging Category, Its Sub-Categories, and Key Tools

Introduction
This report is designed to help BI and analytics leaders navigate Analytics Governance, an emerging category that is progressively taking shape. It maps the market as it stands today, documenting the sub-categories and vendors that define it, so buyers can understand the landscape and evaluate where each Analytics Governance tool fits.
Self-service analytics software have enabled organizations to scale analytics faster than ever before, placing insights directly in the hands of business users. Yet as adoption has accelerated, scaling without control introduced new challenges: proliferation of reports and dashboards, inconsistent KPI definitions, unclear ownership, conflicting data, rising cloud-computing costs, and growing doubts about the reliability of the insights used – all of this now exacerbated by the rise of AI Analytics, whether through GenAI-powered insights, conversational BI, or agentic analytics workflows. In fact, trust in data remains one of the main barriers to adoption today, despite growing usage.
Business users are now struggling to identify which reports can be trusted. Teams spend increasing amounts of time answering basic questions: Which dashboard should I use? Is this metric or insight correct? Why did this report change? instead of delivering higher‑value insights. Meanwhile, executives are expected to make critical decisions based on analytics assets that are often poorly governed, insufficiently controlled, or widely duplicated.
This is where Analytics Governance addresses these challenges. It focuses specifically on the BI and analytics layer and addresses how analytics artifacts such as semantic layers, BI reports, dashboards, and KPIs are documented, built, verified, delivered, shared, monitored, secured, and retired across BI platforms. Capabilities such as analytics catalogs and portals, BI testing, BI monitoring, lifecycle management, permission management, and KPI governance form the foundation of a governed analytics environment.
The market is being shaped by several converging forces. Self-service analytics made Analytics Governance necessary; AI Analytics is now making it indispensable, as organizations cannot afford to feed AI with ungoverned, untrustworthy analytics. Beyond AI, several other forces are reinforcing this need: the financial pressure of consumption-based pricing models, where every query, refresh, or AI-generated insight now carries a direct cost in tokens, capacity units, DBUs, or compute credits, increasing executive scrutiny of decision quality, and the reinforcement of data-related regulations such as GDPR, all of which amplify both the value and the risk of ungoverned insights.
As a result, Analytics Governance is becoming a new frontier for Data & AI Leaders, Data Governance organizations, and BI Leaders. Gartner® formally recognizes it in its Hype Cycle™ for Data and Analytics Governance since 2024, and its 2026 edition signals a decisive shift: Analytics Governance is no longer just about managing dashboards and reports. The rapid rise of AI has intensified the urgency, as organizations now need their analytics layer to be not only governed, but AI-ready. Gartner® projects that by 2027, 60% of organizations will fail to realize AI value due to a lack of integration between data governance and AI governance1, and Analytics Governance sits at the center of that gap. Gartner also draws a sharp distinction between policy setting, policy enforcement, and policy execution, warning that many vendors sell governance solutions that only support the latter, leaving organizations with programs that fail to deliver expected benefits. For buyers, this means that deploying a data catalog or a native BI tool feature is rarely sufficient: dedicated Analytics Governance tooling is required to govern how analytics content is created, validated, distributed, and trusted at scale.
Disclaimer:
The inclusion of any vendor in this report does not constitute a recommendation or endorsement. While we have made every effort to ensure the accuracy and completeness of this analysis, the information presented may contain omissions or inaccuracies. This report is intended to provide a comprehensive overview of the emerging Analytics Governance market. As part of this approach, we have deliberately focused on independent software vendors (ISVs) contributing to the development of this category and have voluntarily excluded open-source solutions and native BI vendor capabilities from the scope. Readers are encouraged to conduct their own research and evaluation when assessing Analytics Governance tools and vendors. This report is aimed at being regularly updated to reflect the evolution of Analytics Governance as a category.
1Gartner, Hype Cycle for Data and Analytics Governance, 2026, Guido De Simoni and Sally Parker, 4 June 2026
GARTNER is a registered trademark and service mark of Gartner, Inc. and/or its affiliates in the U.S. and internationally and is used herein with permission. All rights reserved. Gartner does not endorse any vendor, product or service depicted in its research publications, and does not advise technology users to select only those vendors with the highest ratings or other designation. Gartner research publications consist of the opinions of Gartner’s research organization and should not be construed as statements of fact. Gartner disclaims all warranties, expressed or implied, with respect to this research, including any warranties of merchantability or fitness for a particular purpose.
Market Overview
Gartner defines Analytics Governance as ‘the setting and enforcement of governance policy along the analytics pipeline,2‘ spanning from data extraction and transformation through to the delivery of analytics insight to end users. This report builds on that definition by focusing specifically on the vendors and capabilities operating at the final stage of that pipeline; the BI and analytics consumption layer, where insights are delivered, verified, and consumed.
Rather than operating at the data infrastructure level, Analytics Governance tools concentrate on the analytics consumption layer, where business users interact with insights and where governance directly impacts decision making.
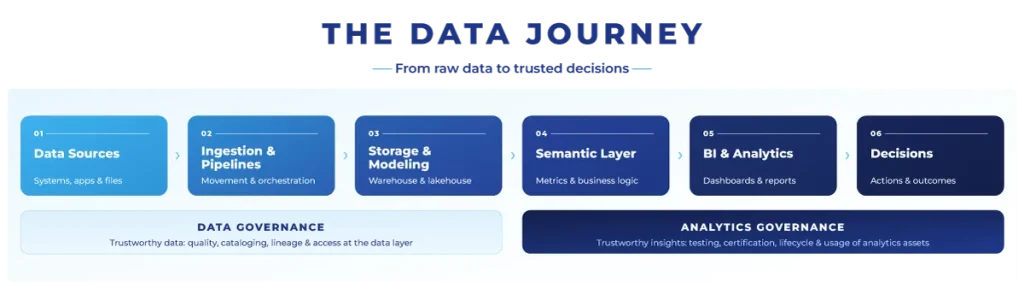
Analytics Governance picks up where Data Governance leaves off — the two disciplines overlap at the semantic layer, where data becomes insight.
At a functional level, the market covers:
- Cataloguing and discovery: Centralized visibility and organization of reports and dashboards
- Trust and certification: Validation mechanisms to identify reliable, production-ready analytics
- Usage analytics and rationalization: Insight into adoption to optimize performance, cost, and relevance
- Testing and change impact analysis: Detection of errors and assessment of downstream impact from changes
- Lifecycle management: Controlled movement of analytics assets from development to production
- Version control: Tracking of changes for auditability and collaboration
- KPI and metric governance: Standardization and ownership of business definitions
2Gartner, Hype Cycle for Data and Analytics Governance, 2026, Guido De Simoni and Sally Parker, 4 June 2026
GARTNER is a registered trademark and service mark of Gartner, Inc. and/or its affiliates in the U.S. and internationally and is used herein with permission. All rights reserved. Gartner does not endorse any vendor, product or service depicted in its research publications, and does not advise technology users to select only those vendors with the highest ratings or other designation. Gartner research publications consist of the opinions of Gartner’s research organization and should not be construed as statements of fact. Gartner disclaims all warranties, expressed or implied, with respect to this research, including any warranties of merchantability or fitness for a particular purpose.
Key Players By Category
The Analytics Governance market is characterized by a broad ecosystem of solutions, addressing different aspects of governance at the BI and analytics layer. To provide a clear and actionable view of this landscape, we structured the market into the following categories based on analysis of vendor positioning, product capabilities, and real world use cases across enterprise BI environments. This approach is aligned with broader industry recognition of Analytics Governance as a distinct and evolving category: Gartner has formally recognized it in its Hype Cycle for Data and Analytics Governance, which tracks the maturity and adoption of governance technologies across the analytics landscape. We think this provides a clear view of the market, showing where vendors solve specific problems, and where organizations often need multiple tools to cover their governance needs.
Analytics Hub/BI Portal: distribution and access to BI content
As organizations scale analytics across multiple BI tools (on average, 4 or more per company), fragmentation becomes a core challenge, with duplicated dashboards, inconsistent KPIs, and multiple versions of the truth. As a result, business users often spend significant time searching for the right report and validating whether it can be trusted.
This category includes BI portals, analytics hubs, and BI catalogs that operate at the consumption layer, centralizing access to analytics across platforms and improving discoverability.
We selected these vendors based on their ability to provide a unified access layer across fragmented BI environments. From a governance perspective, this category addresses a core objective of Analytics Governance: the controlled distribution of insights, ensuring that users can access consistent and relevant information.
Metric Insights
Positioning: An enterprise BI portal that consolidates all BI tools, reports, and metrics into one governed catalog.
Differentiator: Drives analytics consumption through personalized BI experiences, curated content delivery, alerts, digests, mobile access, and collaboration integrations, with AI support via its BI Concierge.
Best For: Large organizations with fragmented BI estates whose core problem is engagement and adoption.
Digital Hive
Positioning: Unified analytics catalog and BI portal bringing reports, dashboards, explanations, and context together in one place.
Differentiator: The “Netflix for BI content”: making BI content discoverable, personalized, and genuinely enjoyable to use.
Best For: Organizations with adoption issues and content spread across multiple BI systems.
Webdashboard
Positioning: Power BI-built portal for sharing and managing reports, with white-labeling and custom branding.
Differentiator: Built on Power BI Embedded, enabling report sharing with internal and external users without requiring individual Power BI licenses.
Best For: Client-facing analytics delivery in Power BI environments.
Curator (Interworks)
Positioning: Analytics portal platform unifying Tableau, Power BI, and ThoughtSpot content into a single branded interface.
Differentiator: Available as a fast-deployment SaaS product or a fully custom build for client-facing data products, with a strong focus on personalization.
Best For: Driving user adoption and engagement with existing analytics investments.
Watch For: Positions itself primarily as an experience layer that drives engagement rather than a governance tool per se.
Loome
Positioning: Unified analytics asset portal centralizing reports and datasets from Power BI, Tableau, ThoughtSpot, SAP BusinessObjects, and other platforms into a single governed catalogue.
Differentiator: Publishing controls, mandatory metadata capture, and role-based audience targeting.
Best For: Organizations needing users to find and access the right content across a governed, multi-platform catalogue.
Orbit One (Biztory)
Positioning: An analytics orchestration platform that consolidates Tableau, Power BI, Snowflake, and others into one unified Analytics Hub, built as plug-and-play modules: a cross-platform suite including an analytics portal, report distribution, monitoring, AI-powered insights, documentation, and governance/admin capabilities.
Differentiator: It bundles portal, distribution, and BI administration in one modular package. Center of gravity is Tableau: several modules are Tableau-specific, with multi-platform coverage strongest in the Portal and admin layers.
Best For: Mid-size, Tableau-first organizations (often with Power BI or Snowflake alongside) wanting one affordable toolkit for the front door, report distribution, and admin visibility.
ZenOptics
Positioning: An analytics catalog evolving into a decision intelligence platform.
Differentiator: Uses its BI catalog as a governed context layer for AI-driven questions, workflows, and decision support. ZenOptics does not explicitly position itself as an AI analytics solution, but this is where we see an interesting evolution.
Best For: Organizations, especially regulated ones, that want governance wired into business processes and are preparing for agentic analytics.
APOS
Positioning: Not a BI portal or catalog in the strict sense, but addresses the same underlying problem: how analytics content is shared, delivered, and consumed at scale.
Differentiator: Automates the generation and distribution of personalized BI content, ensuring each audience receives the right content, in the right format, location, and time, across SAP Analytics Cloud, SAP BusinessObjects, Power BI, Tableau, and Looker.
Best For: Operationalizing governed analytics delivery across diverse user groups.
Watch For: Functions as a multi-platform distribution layer sitting on top of existing BI investments rather than a portal or catalog itself.
Wiiisdom
Positioning: Not a BI portal per se, but relevant to this category by addressing the same underlying problem from a different angle: helping users find and trust the right analytics content.
Differentiator: Rather than creating a separate access layer, Wiiisdom embeds governance directly into Tableau and Power BI environments, where analytics content is already created, consumed, and managed. Unlike certification badges available in BI portals or native BI systems, Wiiisdom’s certification acts as a trust indicator based on evidence: validation results, governance rules, usage and quality signals. This helps teams identify trusted assets, monitor their reliability over time, and give users context at the point of consumption.
Best For: Organizations wanting governed discovery inside their existing BI tools rather than a new portalization layer.
Analytics / BI Testing: data quality applied to BI assets
Ensuring the accuracy and reliability of dashboards and reports is critical as AI-powered analytics experiences are increasingly built on top of the BI layer. Tools such as Copilot for Power BI, Tableau Agent, and Gemini in Looker allow users to ask questions, generate summaries, and explore insights in natural language. But these AI experiences are only as reliable as the semantic models, reports, dashboards, calculations, and KPIs they rely on.
This raises the stakes for BI quality. If a dashboard contains a broken calculation, an outdated dataset, or an inconsistent KPI definition, AI does not remove the issue; it can amplify it by turning unreliable content into confident, conversational answers. As a result, testing and validation at the analytics layer are no longer just operational controls. They are becoming a prerequisite for trusted AI analytics. This category includes BI testing and automated validation solutions, often associated with AnalyticsOps or BI DevOps, which bring quality assurance, testing, and data reconciliation practices to the analytics layer.
We selected these vendors based on their ability to validate analytics outputs, detect regressions, and assess change impact, ensuring that insights remain consistent and trustworthy over time. From a governance perspective, these solutions address a critical objective: guaranteeing the integrity of analytics before and after deployment, especially as AI assistants and agents begin consuming and interpreting BI content on behalf of business users.
Wiiisdom
Positioning: Automated BI testing and validation that continuously monitors dashboards, reports, and semantic layers to detect discrepancies, regressions, and data inconsistencies. Integrated with Power BI, Tableau, and SAP BusinessObjects.
Differentiator: A pioneer in this segment through its patent-pending dynamic certification capability, which can certify or decertify BI content based on validation results and governance rules; a critical requirement as AI Analytics increasingly depends on trusted and certified BI assets. Also, the first vendor to bring an agentic Analytics Governance narrative to market, with agents supporting testing, certification, and monitoring workflows.
Best For: Analytics-first buyers at enterprise accounts where BI trust, scale, and AI-readiness are strategic priorities.
BI Validator by Datagaps
Positioning: Robust testing platform covering functional, regression, performance, and stress testing of reports and dashboards across Power BI, Tableau, and Oracle Analytics. Its positioning is more technical and execution-oriented.
Differentiator: A broader, end-to-end data quality approach spanning ETL processes and data reconciliation through to the BI report layer.
Best For: QA teams and data management teams that take an end-to-end view of data quality, from source and ETL pipelines through to the reports users consume.
QuerySurge
Positioning: BI testing centered on business validation, regression testing, and data reconciliation.
Differentiator: Compares reports across environments, tests migrations between BI tools or versions, validates report outputs, and queries report metadata across Power BI, Tableau, IBM Cognos, Strategy, SAP BusinessObjects, and Oracle BI.
Best For: Organizations needing focused business validation and migration testing.
iceDQ
Positioning: Data reliability and BI testing platform combining automated testing, data reconciliation, and monitoring across the full data lifecycle.
Differentiator: Validates ETL pipelines, data warehouses, and BI reports; compares data across sources; integrates testing into CI/CD and DataOps workflows.
Best For: Teams needing testing across the full data lifecycle, not just the BI layer.
Tricentis
Positioning: Leader in AI-augmented software testing and enterprise quality engineering, built primarily for software development and DevOps teams, making it outside Analytics Governance strictly speaking.
Differentiator: Its Data Integrity product extends capabilities to data pipelines and BI outputs, giving it some relevance in the analytics testing space.
Best For: Organizations already invested in Tricentis for broader software QA who want to extend into data pipelines and BI outputs.
Watch For: The heavyweight of this category; typically not suited for BI Leaders looking for BI-first testing solutions.
BI Usage & Tenant Monitoring: visibility into adoption, performance, and cost across BI environments
This category addresses the need to monitor, analyze, and optimize how analytics assets are used across BI environments.
We selected these vendors based on their ability to provide visibility into adoption, performance, and cost drivers, supporting rationalization and FinOps initiatives. As BI platforms increasingly move to capacity based pricing, usage monitoring has become a key governance function.
Wiiisdom
Positioning: Cross-BI usage analytics and monitoring, identifying redundant or underused assets, optimizing environments, and controlling platform costs.
Differentiator: Out-of-the-box predictive insights that anticipate issues before they become outages, degraded user experiences, or unexpected cost increases. By applying intelligent scoring and automated triage across usage, performance, and design signals, it identifies high-footprint assets, noisy neighbors, and inefficient behaviors, then recommends actions with AI to optimize the BI environment.
Best For: Organizations running FinOps initiatives for BI who want to link usage, performance, lifecycle, and governance signals to reduce waste, improve platform stability, and maintain trust in analytics at scale.
Power BI Sentinel
Positioning: Governance and auditing platform for Power BI and Microsoft Fabric, providing usage analytics, permission monitoring, data lineage, and change tracking across the entire tenant.
Differentiator: Deep, purpose-built integration with the Microsoft ecosystem, giving BI teams granular visibility into who is accessing which reports, how content evolves, and where sensitive data is exposed.
Best For: Microsoft-centric organizations needing that granular visibility.
Watch For: Less suited to large enterprises running multiple BI systems (Tableau, Qlik, SAP, etc.) that need a unified governance framework.
ArgusPBI
Positioning: Whole-tenant monitoring solution for Power BI, giving administrators operational visibility into usage patterns, workspace activity, report adoption, and environment health.
Differentiator: Tenant-wide operational visibility purpose-built for Power BI.
Best For: Microsoft-centric organizations.
Watch For: Single-platform, like Power BI Sentinel, so less suited to large enterprises needing multi-BI governance.
Datalogz
Positioning: A monitoring platform for Tableau, Power BI, Qlik, Sigma, and Spotfire, positioned around ending BI sprawl; a message increasingly relevant as AI-generated analytics content risks multiplying dashboards, reports, and duplicated analytics products even faster than self-service BI did.
Differentiator: Consolidates visibility, by highlighting duplication, security risks, cost leakage, and performance issues, and helping organizations reduce the number of unmanaged assets.
Best For: Multi-BI organizations concerned about sprawl and AI-readiness of their analytics layer.
Motio
Positioning: BI usage and monitoring aren’t Motio’s core focus, but it provides monitoring and governance features within its broader BI management capabilities, offering visibility into usage and environment activity.
Differentiator: Stronger positioning around mature BI lifecycle management, particularly in IBM Cognos environments.
Best For: Organizations prioritizing BI lifecycle governance (version control, migration, deployment, regression testing) over modern cross-BI monitoring.
BI Lifecycle, DevOps & Version Control: controlled development, deployment, and versioning of analytics assets
Managing how dashboards, reports, and semantic models evolve over time has become a key governance challenge. Unlike traditional BI workflows, modern analytics development requires controlled processes for deployment, versioning, and change management across multiple environments.
This category includes solutions that bring BI DevOps and Application Lifecycle Management (ALM) practices to the analytics layer. These tools focus on structuring how analytics assets are developed, approved, promoted, and maintained, reducing the risk of errors and improving collaboration between teams. We selected these vendors based on their ability to introduce governance into the lifecycle of analytics assets, ensuring traceability, consistency, and control across environments.
Motio
Positioning: Lifecycle and migration management capabilities, particularly for IBM Cognos, Qlik, and more recently Power BI.
Differentiator: Enables teams to control deployments, manage version transitions, and govern upgrades of BI content in a structured and auditable way.
Best For: Organizations standardizing lifecycle governance across Cognos, Qlik, or Power BI.
Wiiisdom
Positioning: Extends BI lifecycle management beyond deployment automation and auditable versioning into a proactive control layer across the analytics lifecycle, tracking changes and promoting content safely across Tableau, Power BI and SAP BusinessObjects environments, and enforcing governance policies before assets reach production.
Differentiator: Design policies that help prevent the proliferation of poorly designed, inefficient, or non-compliant BI content that can degrade platform performance, increase costs, and ultimately undermine trust, combining lifecycle workflows, validation, policy enforcement, and auditability.
Best For: Highly regulated organizations across Tableau and Power BI wanting governed analytics as the default path rather than a reactive clean-up exercise.
PlatformManager
Positioning: Application Lifecycle Management solution for Qlik Sense, Qlik Cloud, QlikView, Power BI, and SAP BusinessObjects, providing version control, deployment automation, data lineage, and governance workflows.
Differentiator: Enforcement-oriented pipeline discipline: mandatory approval steps before anything reaches production, two-click rollback, automated deployment that removes manual steps, and full lifecycle reporting supporting regulatory compliance.
Best For: Qlik-heavy and multi-platform BI teams.
Tabular Editor
Positioning: Not positioned as an Analytics Governance vendor, but included because it addresses the same underlying problem from a semantic-model design perspective.
Differentiator: Specialist development tool for Microsoft tabular models; advanced model editing, scripting, version control, Best Practice Analyzer rules, and Git-based workflows.
Best For: Power BI, Fabric, SSAS Tabular, and Azure Analysis Services teams wanting better-designed, more consistent semantic models.
Ebiexperts
Positioning: The WIP platform provides version, quality, deployment, and audit management for Qlik, Power BI, and SAP BusinessObjects applications, covering the lifecycle from planning through release.
Differentiator: Adds a project-delivery layer on top of version control: an integrated Agile board for sprints and tasks tied directly to BI assets, with bidirectional Jira synchronization.
Best For: Technical BI engineering teams wanting practical ALM tooling per platform. Deep Qlik roots.
Watch For: Less directly aligned with buyers seeking a broader, unified governance layer across the analytics estate.
Semantic Lineage & Metric Visibility: bottom-Up logic auditing
One of the more complex governance challenges is understanding how business logic and metrics are defined across dashboards and reports. In many cases, key KPIs such as Churn or ARR are directly embedded in BI assets, creating inconsistencies and making it difficult to trace how insights are calculated. This category focuses on analyzing lineage and metadata at the analytics layer, providing visibility into how metrics are built and transformed.
We selected these vendors based on their ability to expose dependencies, trace logic, and improve transparency and consistency of metric definitions. From a governance perspective, this category addresses a critical objective: ensuring that metrics are clearly defined, traceable, and reliable across the analytics ecosystem.
Euno
Positioning: An active metadata governance platform for the modern data stack. It maps business logic across dbt, warehouses, and BI tools (Looker, Tableau, Power BI).
Differentiator: The dbt-first shift-left workflow is unique in the category: rather than only documenting sprawl, Euno actively consolidates business logic into the data layer.
Best For: Modern-stack data teams (dbt + Snowflake/Databricks + Looker/Tableau/Power BI) fighting metric sprawl between the data and BI layers, and building governed context for AI analytics agents.
Select Star
Positioning: An automated data catalog, lineage, and semantic model platform.
Differentiator: Exposes metadata, ownership, usage, popularity, and column-level lineage across data warehouses and BI tools, helping teams understand where data comes from, how it flows into dashboards, who owns key assets, and which downstream reports may be affected by upstream changes.
Best For: Teams needing discovery, impact analysis, and context to govern analytics intelligently. Going forward, buyers should evaluate it as part of the Snowflake Horizon roadmap rather than as an independent vendor.
Watch For: More about giving teams context than enforcing governance directly inside BI platforms.
Octopai
Positioning: A pioneer in automated data lineage and metadata management, now part of Cloudera.
Differentiator: Depth of automated harvesting across legacy and hybrid estates: multi-dimensional lineage spanning cross-system, inner-system, and end-to-end column levels, drilling into ETL, stored procedures, and reporting layers, cloud and on-prem.
Best For: Enterprises with complex, hybrid, multi-vendor legacy BI/ETL estates needing root-cause analysis, impact analysis, and migration support.
BI Observability: monitoring upstream data pipelines for issues that affect BI
This category includes solutions focused on monitoring data pipelines and detecting anomalies, typically at the data layer rather than directly within BI tools. These platforms aim to ensure the reliability of data feeding analytics by identifying issues such as broken data flows, unexpected changes, or anomalies in upstream systems.
At this stage, we don’t consider BI observability solutions to be part of Analytics Governance, strictly speaking. We include a handful of vendors here for completeness and at a lighter level of detail than the categories above, since their primary focus sits at the data layer rather than the analytics consumption layer:
Monte Carlo:
data and AI observability platform that traces how changes to source data ripple into downstream BI assets, automatically mapping incidents to the reports and consumers they affect.
Sifflet:
data observability platform covering the full pipeline, from the data warehouse through orchestration to BI, closing the gap between the warehouse and the report the business consumes.
BigEye:
enterprise observability platform combining anomaly detection with end-to-end data lineage, tracing where a number came from and which downstream reports are affected.
Metaplane (now part of Datadog):
observability platform focused on catching quality issues before they reach BI consumers, with column-level lineage and CI/CD forecasting of downstream report impact.
Opportunities & Risks in the Analytics Governance Market
Opportunities:
1. Rise of AI-Analytics
When AI produces insights, you need to be able to explain where they came from and whether they can be trusted. That need is creating a new frontier for governance vendors with lineage, observability, and semantic layer capabilities.
2. Expansion of Self-Service Reporting
As self-service analytics has scaled, organizations have realized that ungoverned access can create more problems than it solves. The need for Analytics Governance tools is no longer a nice-to-have but a must-have to ensure trusted analytics.
3. Capacity-based pricing, FinOps, and BI resource optimization
Usage-based pricing models from platforms like Power BI have elevated Analytics Governance from a technical concern to a financial one. When poorly optimized reports, unchecked queries, redundant datasets, or underused dashboards carry a measurable cost, organizations need stronger visibility into adoption, resource consumption, and platform efficiency. This creates an opportunity for governance vendors to position themselves around FinOps, cost avoidance, and operational efficiency by helping teams rationalize analytics landscapes and reduce waste.
Risks:
1. Confusion between Data Governance and Analytics Governance
Analytics Governance is still often confused with Data Governance. The two disciplines are related but remain distinct: Data Governance addresses the quality and management of data at source, whereas Analytics Governance addresses the final layer of the data journey, the analytics layer, also known as the consumption layer, where business decisions are made. Until this difference is properly understood by buyers, vendors will struggle to convince them that their budget isn’t in the right part of their organization.
2. Organizational ownership
Analytics Governance sits at the intersection of IT, data engineering, BI teams, and the business, and in many companies, no single team has a clear mandate. Without an internal champion, procurement stalls and adoption stays low.
3. Market Consolidation
Data Governance vendors are actively acquiring BI and Analytics Governance players, such as Castordoc by Coalesce, Select Star by Snowflake, and Octopai by Cloudera. This consolidation is logical, as Data Governance and Analytics Governance are increasingly seen as complementary and indispensable disciplines: one governs data at the source, while the other governs how that data is transformed into trusted analytics for decision-making. The challenge for Analytics Governance vendors is therefore not to compete with Data Governance, but to clearly articulate the specific value they bring at the BI and analytics consumption layer.
4. Multi-BI environments raising the bar for vendors
Organizations running Power BI alongside Tableau, SAP, or Qlik face governance challenges that single-platform vendors simply cannot address. Vendors that cannot demonstrate credible coverage across complex, regulated environments will struggle to land in the accounts that need governance most.
Strategic Insights
The Analytics Governance market is maturing, but there still lacks a clear understanding of what it means, who owns it, and how to measure its value. Here are some insights into how buyers can navigate the market more easily:
1. Separate Data Governance from Analytics Governance in tooling decisions
These are two distinct disciplines that require two different investments. It’s not because your data is governed that it remains governed in the analytics layer. Both disciplines need individual tooling.
2. Prioritize usage analytics, certification and testing before lifecycle automation
Start by looking at what is being used, what can be trusted, and where errors exist. Lifecycle automation delivers more value once that foundation is in place.
3. Avoid single BI only governance unless platform lock in is in explicit strategy
On average, most companies have four or more BI platforms, and governing only one of them can create governance debt. The value does not come from the number of platform-specific flows you automate, but from the governance logic you add across the analytics environment: consistent rules, certification criteria, testing, monitoring, and policy enforcement that can scale beyond a single BI tool.
Conclusion
Analytics Governance is no longer a nice-to-have. As self-service reporting has scaled, so has the cost of getting it wrong: eroded trust, decisions made on untrustworthy content, and now another wave of data exposure as AI Analytics starts to generate, summarize, and distribute insights at scale. The market is responding, but it remains fragmented, with solutions addressing different parts of the problem and buyers still finding their footing on what governance at the analytics layer actually means.
For vendors, there is a real opportunity here, but the category still suffers from definitional confusion, organizational ambiguity, and the gravitational pull of larger data governance platforms acquiring their way in. Standing out requires a clear narrative around business outcomes, cost impact, and the specific risks that ungoverned analytics creates at the consumption layer.
For buyers, the priority is to understand what you have, what is being used, and what can be trusted, then build governance processes around that foundation. The temptation to solve everything at once, or to assume that existing data governance investments cover the analytics layer, remains one of the most common and costly mistakes in this space.
The category will continue to evolve and be shaped by AI adoption, regulatory pressure, and the ongoing financial scrutiny of cloud analytics spend. What is clear is that the organizations and vendors who treat Analytics Governance as a strategic priority today will be better positioned to scale analytics with confidence tomorrow.