The Ultimate Guide
For BI and Data Analytics QA
Data Quality Is No Longer Enough
I recently read that “data quality is not on the tip of most people’s tongues”, but actually in the BI and Analytics world today, I’d say it’s in fact Analytics Quality that isn’t on the tip of our tongues.
It’s obvious that data quality should be part of any organization’s strategic approach to data because the output of the data can only be as good as the input. However, data quality is simply no longer enough. As Ted Friedman at Gartner put it “it is not just the data that requires governance, it is lots of things in the analytics world”.
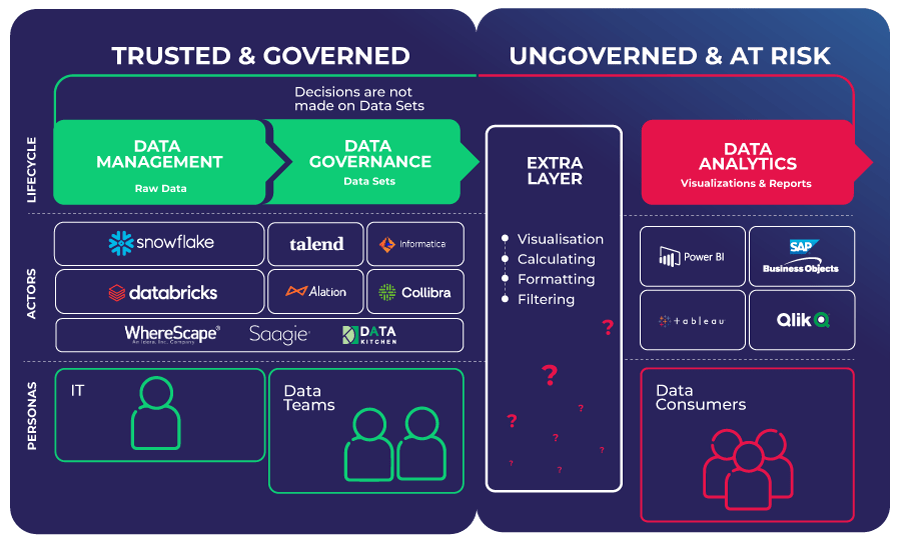
Today, business leaders and professionals are making decisions on ungoverned and untrusted data because they are unaware of the true last mile of the data journey: the analytics layer. The data that is pushed through BI and Analytics platforms may be well governed, but is it still governed and trusted when people consume the data in their dashboards? Are you confident that your Analytics is of the highest standard of quality? Are you certain that you give the same attention and do the same governance checks to the analytics data layer as you do in the data layer? Do you have an Analytics QA process in place to fully ensure this?
Unfortunately, measuring Analytics quality is often skipped but it’s a vital process in this last mile of the data journey. People need to be able to trust their Analytics which comes down to knowing (and not guessing) that they’re working with high-quality Analytics. A Quality Assurance (QA) process provides the ultimate reassurance that an organization’s Data Analytics is governed, not at risk, and trusted decisions can be made.
“The idea of trust is so crucial and fundamental to driving any kind of value from data and analytics.”
Ted Friedman, Gartner.
At Wiiisdom, we believe that everyone should be able to make accurate decisions based on their BI and Data Analytics at all times. Data Analytics should always be your path to more success, and never something that jeopardizes your company’s reputation, or worse. This white paper will demonstrate the key factors of quality assurance for your Analytics so that organizations no longer have to question their Analytics again.
An Analytics QA Process Is For The Long-Run
A clear and well-planned QA process is crucial for Analytics quality success and should be one of the standards every organization strives for. A QA process for Analytics allows organizations to measure the quality standards of their Analytics and BI content, which essentially is performed through BI Testing, in order to spot bugs, issues, opportunities for improvement, and most importantly avoid bad decisions being made. The cost of releasing poor Analytics quality is far too high for companies to manage so it makes implementing testing processes imperative.
A QA life cycle consists generally of 6 steps:
1. Requirement Analysis
This stage is to identify and decide the requirements needed to be tested, for example, what is the maximum amount of time a dashboard can take to open, or will a dashboard display valid KPIs. These requirements will be discussed with the Line of Business who have the business knowledge.
2. Test Planning
Here the QA team decides what will be tested based on the requirements identified, how they will be tested, by who, and what resources will be needed.
3. Test Case Design
The third step involves creating test cases in your chosen environment, whether that be QA, test, or production, which also includes integrating the expected results so that the testers can clearly identify if tests pass or fail.
4. Test Execution
It’s time for the magic to happen and launch the tests for the outlined requirements.
5. Test Analysis
Once the tests have finished, the QA team will analyze the results and identify if there are any failed tests, and if so, repair and re-test until all tests have successfully passed.
6. Test Automation
The QA team can automate all its testing with the help of solutions, such as Wiiisdom for Tableau, to remove the risk and pain of manual error-prone testing.
What is important to remember is that an Analytics QA process is a continuous process. Automation will allow for all five steps to be continuously carried out in order to ensure the highest level of quality at all times.
Who Makes Up A QA Team?
In order to build a system, it requires people, processes, and technology. For an Analytics QA process to be successful, organizations first need to have the right people.
There are three main roles within an Analytics QA team:
- Analytics QA Manager: works closely with other departments to have the full business understanding and customer requirements, and oversees the QA team to ensure a smooth workflow.
- Analytics QA Analyst: executes and evaluates the system, documenting tests and the overall status for the QA Engineer. In most cases, they’re the main point of contact with the line of business that is consuming the data. They play an important part in making the test a pivotal role in a continuous improvement process.
- Analytics QA Engineer: creates tests based on the business and its requirements, and tests Analytics for bugs and issues to make sure they comply with requirements, all while working in an agile environment with the technologies made at their disposal.
Like any role, it comes with its challenges and each member of a QA team will face them:
- QA Manager:
- No clear QA goals
- Analytics silos within the company
- QA Analyst:
- Last-minute changes to requirements
- Buggy products
- New features at the last minute
- QA Engineer:
- Unstable environment requiring the server to be restarted before testing
- Tight deadlines
Primary Causes Of Analytics Quality Issues
“My data is checked before it goes into my BI application, could it not be checked on the way out?”
Just like you take the same trip to the office every day without any issues then suddenly one day traffic hits and all hell breaks loose, it works the same as with your data. Everything could be working just fine then one day the Line of Business starts seeing issues in their Analytics causing them to doubt the quality. Have you ever had doubts about the data in a report or dashboard? Have you ever downloaded the raw data locally to check it yourself?
Again, having good data is not enough. It may be trusted and governed but it won’t stay like that for long. There are three other steps the data goes through before the data is displayed in a dashboard:
- Analytics data preparation (for example Tableau Prep, Power BI Query)
- Creation and refresh of datasets and data cubes
- Dashboard design
During these three steps, the data can still be tweaked and altered especially with self-service solutions, thus impacting the Analytics quality in the true last mile of the data journey.
Poor Analytics quality creates a ripple effect in any organization; lack of trust, lack of user adoption, risk of poor decision-making, there is such an array of factors that cause a break in Analytics today. Besides the risks from data manipulations in the Analytics layer, there are many reasons why the quality of data Analytics can be jeopardized. Here we will explain the top 6 causes of Analytics quality issues that you should be aware of to avoid the risk of poor Analytics quality:
1. The Rise Of Self-Service Analytics
We won’t lie, self-service Analytics is great but the modern Analytics vendors promoting this are opening Pandora’s box to non-IT people, therefore increasing the risk of ungoverned data and a lower quality of Analytics. As opposed to the old days where it was an IT/BI function creating the Analytics content used for decision making, today anybody can do it however skilled or not they might be, but with a less rigorous validation process. There is a need to set guidelines without breaking the spirit of self-service. A verification and certification process must be put in place to ensure that the organization as a whole is not using bad data for decision-making.
2. Garbage In, Garbage Out
If your data input is flawed, it will only produce a nonsense output. This is particularly risky in regulated industries such as financial organizations where companies deal with sensitive information where there can be no room for error.
Let’s take this example: the first step is always of course to connect to the data source(s). This is a critical step as any mistakes happening here will have consequences when it’s time to make decisions based on the Analytics. Misunderstanding how data sources have been built, making mistakes when merging with other sources, connecting to ungoverned data, and having errors during the Data Prep stage will all lead to serious consequences.
Just because the data in the data warehouse is governed, it doesn’t mean that there can never be an error later on. This is why data reconciliation tests between the dashboards and the data in the data warehouse are needed to certify the validity of the data from start to finish.
3. Software Evolutions and Updates
Any changes made by the Analytics platform vendor can increase the risk of poor Analytics quality because the changes could have a direct impact on the dashboards you have created and published. To ensure the quality of your Analytics isn’t jeopardized, testing must be done after any updates to your Analytics software, no matter how big or small.
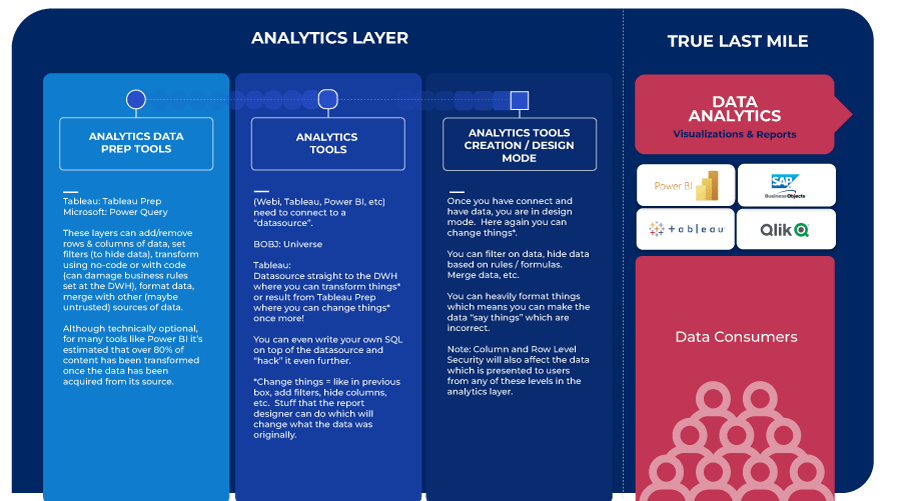
4. Only Testing At The Data Prep Level
Some organizations think that testing at the Data Prep level (creating an Analytics dataset) is enough, but between this stage and the last mile of the data journey, there are still many opportunities for the data to be transformed so the quality of the Analytics is still compromised. The journey your data takes is longer and more perilous than you might think! Between what you see in the charts of your favorite Analytics solution and the data at its source (let’s say here in your Governed Data Warehouse), there are many steps where the data is acquired, transformed, connected to, and often changed again. Equally, any testing at the Data Prep level is often done manually which is very error-prone.
Imagine having a DWH containing your entire company’s financial data, but you are interested in delivering Analytics for the current year and for European countries only. After making sure everything is OK (e.g. confirming only 27 countries are on the list, not 28, data is for 2022 only), and dealing with duplicates and nulls, etc you then share this prepped dataset to be used for creating visualizations. Creating visualizations on top of a dataset still gives several opportunities to the end-user to make further transformations to the data that was first “validated”. Connecting to multiple datasets, removing data by using filters, coding mistakes in formulas, the list could go on.
5. Row-Level Security
Row-level security allows organizations to restrict certain data to specific groups of individuals so they only access data rows that are pertinent to them. However, this too can cause quality issues. Imagine a user has access to sales information in France but then moves to the UK and then only sees UK sales information when in fact they need both. How can they ensure trusted Analytics of the French sales information when they can no longer access the data?
6. Customizing the SQL
An SQL statement is used to connect the data warehouse and the data prep level but it can be customized. This customization increases the risk of the data quality when used for Analytics, only highlighting even more that Analytics quality issues can arise from any stage of the data journey.
Best Practices For High Analytics Quality
There is no set Analytics QA process for organizations, each company will decide how they manage this in its own way, but for it to be more successful, establishing a BI testing culture needs to be a priority. To help define an Analytics QA process for your organization, there are some noteworthy best practices across the world of QA that you can put in place. Here is a non-exhaustive list of QA best practices that you should consider for your organization:
Collaborate With The BI Team
A QA team needs to work closely with their BI team to understand how the products work and more importantly how customers use them. Equally, the QA team needs to be informed of any upcoming releases so that they have the time and resources to carry out any testing.
Leverage Automation
With BI testing being such a big part of a QA team’s role, leveraging automation is a no-brainer. Using automated testing solutions for your BI and Analytics platform will mitigate risks, reduce human errors, allow testing to be carried out more quickly, reduce TCO and ultimately ensure high Analytics quality.
One of our customers automated its Analytics QA process and saved up to 16 hours of pure QA work and up to 2 days of work in total. Thanks to their auto-QA process, the number of back tickets (tickets created by end-users for already-developed Tableau dashboards) was reduced by a staggering 40%.
Start The Process Early On
According to research, fixing a bug after a product release costs 4 to 5 times more than fixing it during the QA process, which only highlights, even more, the importance of QA right from the very start of a project. If organizations want high Analytics quality, a QA process cannot simply hop in and hop out of a project, it has to be continuous.
Test Every Fix Or Change
High Analytics quality only comes from testing every fix or change within your Analytics platform. This can be split into two groups: planned projects vs. unexpected changes.
Planned projects include version upgrades, data migrations (e.g. Teradata to Snowflake), or changes to your ETL. Unexpected changes are browser patches, sudden upgrades of the SaaS vendor (Analytics platform, ETL, or database), or a business evolution such as adding a subsidiary.
For unexpected changes, it’s vital to implement continuous regression testing to ensure your dashboards still display the same information. Plus, any changes should be documented so that the QA team can test scenarios to ensure that there is no disastrous impact further down the line.
Our customer leveraged Wiiisdom for Tableau’ regression testing solution during its recent server upgrade and migration projects to make sure the dashboards on the different servers continued to work correctly.
Industry best practice: According to research carried out in the Financial Services Industry, “79% of banking teams run their tests at least daily” to ensure the quality of their Analytics is of the highest standard.
Prepare And Write Test Cases
This may not be the most exciting part of QA but they’re a fundamental part of any QA process because it allows the team to think critically about what they will test and how they will test each feature. The first thing therefore to do is define your goals and requirements to be tested. This should be done by collaborating with the Line of Business that has the business knowledge. To help identify the requirements, it is also useful to look at the usage of your Analytics platform in order to prioritize testing. For example, critical functionalities such as opening visualizations and interacting with the dashboard should be at the top of the list. Test cases are also invaluable for regression testing at the end of a project to verify that the results are as expected.
“Setting up the test cases in Wiiisdom for Tableau can take time depending on the complexity of the dashboard but once done, it has saved us more time than the time it took to set them up. We are able to test everything end-to-end which is great.”
A healthcare organization
Implement Test-Driven Development
Test-driven development (TDD) involves writing test cases, then writing the code, so that the test passes, and keep repeating these steps on a regular basis. It allows the QA team to find issues at the earliest possible phase so they can fix them before merging the changes into the existing codebase. N.B. TDD in Tableau is possible with Wiiisdom for Tableau.
Conduct Risk-Based Testing
If your QA team is struggling to decide how to allocate time to the different testing requirements, organize the testing efforts by identifying what would most be at risk of creating issues when moved to production and thus focus your efforts here. For example, sensitive data, dashboards used by top executives, risk management or finance, or dashboards that are destined for external stakeholders such as customers or auditors.
This is also imperative to do for industries that have to follow very stringent regulations due to the level of data sensitivity they work with. For example, HIPAA for the healthcare industry, FISMA for the federal industry, and SOX for the finance industry. They simply cannot afford any compliance risks, which is why risk-based compliance testing is indispensable to make sure their software solutions are meeting the industry requirements.

Report Errors Effectively
Communication plays an important part in helping achieve high Analytics quality and it’s recommended to put in place processes to report any errors in your Analytics so that they can be fixed in the quickest possible way. Using instant chat solutions like Slack or Microsoft Teams is a great way to do this.
NB: Wiiisdom for Tableau allows you to integrate test reports with Teams, Slack, or any other webhook compatible messaging solution.
Update Test Plans
Writing test plans marks the foundation of every testing project to identify what needs to be tested and by who, but it’s also important to remember to update these plans at any major milestones so that the testing continues to align with the business goals and needs.
Simulate End-User Journeys
End-users expect everything to be working perfectly when interacting with their Analytics. It’s therefore essential that the QA team communicate with the end-users to understand their needs and then simulate their journeys to ensure everything is working properly and find any potential issues before they do.
Implement Analytics SLAs
In the BI and Analytics world, IT and the business are often siloed but to break this and ensure the data provided for the business is of the highest quality, Analytics SLAs can be put in place. It’s a contractual commitment between two sides and KPIs are used so that each side duly respects it. These SLAs can be defined with multiple goals such as the expected performance level, the availability level, the test coverage, the error rate, the number of complaints, etc.
Integrate your Analytics QA processes to a wider CI/CD pipeline
A reliable QA process accelerates delivery and deployment thanks to going through regular BI testing. This fits perfectly into the CI/CD pipeline that focuses on continuous development and testing to ensure Analytics quality. It also allows the QA team to monitor dashboards more easily and be able to find any errors before the users do.
Build your Business Case for Data Analytics Quality
In order to achieve the best Analytics quality, you need to convince BI & Analytics leaders to invest in Analytics quality solutions. We’ve put together a structured approach for you to establish your own business case so that you can ensure trusted Analytics at all times and allow for reliable data-driven decision-making.
Analytics Quality Starts Today
Analytics quality plays a crucial role in the last mile of the data journey to ensure organizations have Analytics that they can trust in order to make the right decisions. It’s not because the data quality is good that you can trust the Analytics. There are varying factors that cause Analytics quality issues but by following the best practices, you can ensure your organization has the highest Analytics quality.
At Wiiisdom, we transform your Analytics landscape into a reliable place to make better, trusted decisions every day, and maximize your data assets. Wiiisdom for Tableau, developed by Wiiisdom, is an agile analytics governance solution that allows our customers to streamline their quality operations with automated testing.
Author: Ailsa Cartledge