Lire cet article en Français ![]()
The Most Important BI Testing
For Any BI and Analytics Platform

Why BI Testing Is The Answer
Trusting your Data Visualization is a key factor when it comes to successfully carrying out Business Intelligence (BI) and Analytics projects. I’m sure you’ve experienced scenarios where your business executives or business users have reported back saying that their analytics look wrong, their KPIs look questionable or it’s just too slow to be usable. The questions to then ask yourselves are: How can you avoid this? How can you ensure user satisfaction? How can you ensure 100% trust in your dashboards? How can you ensure high-quality Analytics? How can you make trusted decisions?
Today, organizations are looking to bring in best practices from the established DevOps and software development practices into the Analytics world. This is why it makes it easy to understand why BI testing is a no-brainer (you can discover what is BI testing here). It’s much more efficient to catch a problem before it reaches production, both for the users (internal) and the consumers (external), rather than having to deal with the consequences later down the line. Learning about errors either internally or externally can be embarrassing at best so it’s important to find any errors before users do – equally, testing for day-to-day monitoring should be put in place after production.
Any organization that uses analytics platforms such as Tableau, Power BI, SAP BusinessObjects, or any other Analytics solution should be carrying out regular BI testing in order to identify issues before they’re seen by users to thus ensure trust and avoid any risk. This article will explain the different BI tests organizations should be doing.
The Different BI Testing You Should Be Doing
We’ve created a non-exhaustive list of the different types of testing you can carry out:
Functional Testing
Have you ever had issues opening a dashboard? Have you ever clicked on a filter or parameters in a visualization and they don’t perform as you intended them to? Examples such as these can be daily annoyances for users but by testing every dashboard functionality, you can be sure you’re providing the best user experience. If there are constant issues, over time users will lose patience and motivation to use them, thus reducing user adoption. A functional test for each element of a dashboard will help resolve those issues.
Regression Testing
Regressions are the highest risk in analytics because they are hard or impossible to spot by human eyes and can be disastrous to decision-making. Examples of regressions are:
- Data
- Image
- Metadata (such as filters or parameters)
- Server and Dashboard performance
To overcome these regressions, regression testing exists to compare two versions of a dashboard/report across time and automatically highlights any differences. Those with experience in testing know that this type of BI testing must be carried out regularly to detect any unwanted changes that could be related to the BI software itself or related to the data source and its path towards the data consumer. It is recommended to apply these tests on sensitive reports and dashboards, to detect any side effects related to a modification for example, and limit the risks involved.
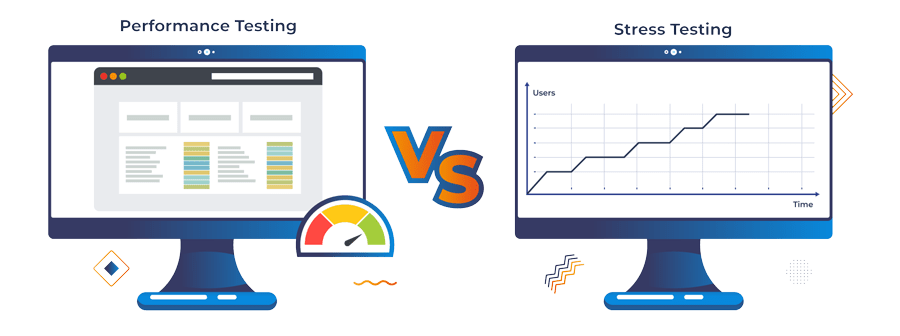
Performance Testing vs. Stress Testing
These two types of BI tests can often be seen as the same but there is a difference!
Performance testing is a test on a number of reports or dashboards to evaluate their performance, i.e. how long individual functional tasks take.
Stress testing allows you to drive load to your server and assess response time and availability. You will be able to evaluate the maximum number of users the analytics platform can handle, the infrastructure needed to run it, and even the sustainability at peak user load. It essentially tests your platform against “standard conditions” to verify it continually performs as it should.

Cross-Environment Testing
With Cross-environment testing, you can compare one or multiple dashboards in a given environment to the same dashboards in another environment (i.e. different sites or servers for dev or prod, etc.) – simply put, regression testing across different environments.
Tolerance Testing or Range Testing
This type of BI testing ensures business users get notified if there is an error in any of their dashboards when a KPI, a metric, or specific data goes outside its set threshold or outside its margin of error. Tolerance testing guarantees that the displayed data is consistently in the acceptable range and detects any issues very quickly.
Upgrade and Migration Testing
Whenever you carry out a migration or an upgrade of your BI platform, testing becomes critical to verify everything is still working as it should be. Do I have the same access level as before? Are my reports and/or dashboards presenting the correct data? Can I trust the data being presented in the new environment? Testing after a migration or an upgrade will provide you with clear answers to all these questions. Bear in mind that any external systems connected directly or indirectly to your BIA platforms such as data sources, data prep tools, and databases during a migration can also cause regressions.
Security Testing
All BI tools have security authentication and authorization requirements, and with single sign-on and embedded capabilities as well, testing all software security aspects is very important. For example, it checks that users have the right access to reports and dashboards based on their access levels and that the same Row Level Security is in place. For those using single sign-on, it also ensures end users are able to access their different BI systems with this capability.
SQL Data Testing
Data testing validates that the Analytics output is equal to the data returned by the SQL query. This test is very popular as it easily determines if regressions found are caused by the Analytics layer in the data journey.
User Acceptance Testing (UAT) or “Smoke Testing”
User Acceptance testing also called smoke testing when applied to Analytics is preliminary testing carried out to check for any simple failures that could reject a potential release. Test cases are run in a test environment to validate that the main functions of the software are working correctly and confirm basic questions such as: “Is my dashboard filling the initial business need?”, “Can I open the viz?, “Is my reporting meeting the performance requirements”.
The True Cost Of Manual BI Testing
These types of Business Intelligence testing can all be automated, thanks to BI testing tools, which is a godsend for organizations because manual testing comes with its costs, and let’s be honest nobody likes to spend time testing anyway, do they?
Here are some of the disadvantages of manual testing:
- Employees are carrying out monotonous and recurring tasks that take up valuable time for more innovative work.
- Manual testing has a high risk of human errors and puts pressure on the testing team carrying it out.
- You can’t fully document the process and have evidence of the tests carried out.
- Manual testing reduces employee motivation because they don’t have time to be more creative and grow their skills.
- Manual testing is inefficient when it comes to data regressions because most of them are unperceivable, thus increasing risk.
- Manual testing is not scalable or repeatable over time, and can not be applied to thousands of BI dashboards and reports.
- Manual testing requires both business understanding and technical capabilities which is hard to find.
- Users will only test a subset of objects because of all these disadvantages of manual testing.
Here at Wiiisdom, we have clients that have succeeded in saving hours of work per month thanks to these different types of testing, thus improving the quality of their dashboards and reporting, and having more time to work on other projects.
Automated BI testing allows you to integrate your tests as part of a wider CI (continuous integration)/CD (continuous delivery) process where dashboards are regularly tested in every step of their lifecycle, all the way from development to maintenance.
How Much BI Testing Are You Doing?
Are you carrying out all these types of BI tests? Do you trust the business decisions you’re making? Automated BI testing is essential for organizations to have trusted quality analytics at all times and be able to make the best business decisions. It also reduces the risks associated with manual testing which can reduce the success of BI projects.
We offer agile automated testing tools for Tableau, Microsoft Power BI, and SAP BusinessObjects — feel free to reach out if you’d like more information.

