Why Tolerance Testing For Tableau Is A Game Changer For Business Users

What is Tolerance Testing for Tableau?
It started as a “small” discrepancy.
Nothing alarming at first glance. The dashboard was loading fine. The KPIs were green. The numbers looked… plausible.
Weeks later, during a quarterly review, someone finally asked the question no one had thought to ask before: “Are we sure this number is still correct?”
A deeper dive revealed the issue. A silent data drift. A calculation that had slowly moved outside its expected range. No errors. No alerts. No broken pipeline. Just a KPI that had been wrong for days, sometimes weeks, without anyone noticing.
Sounds familiar? This situation is far more common than most BI teams would like to admit. In modern analytics environments, data is constantly evolving: sources change, business rules shift, calculations grow more complex. Yet most dashboards are only tested for technical failures, not for business correctness.
That’s where tolerance testing comes in.
Tolerance testing with Wiiisdom for Tableau is a cornerstone of Analytics Governance. It ensures business users are immediately notified if a KPI or data point in their Tableau dashboards falls outside a defined threshold or margin of error. This proactive validation guarantees that only accurate, decision-ready data is displayed, enabling users to trust their analytics with confidence. By embedding business rules directly into the analytics workflow, tolerance testing also breaks down silos between teams, fostering collaboration and shared accountability for data quality.
How can Wiiisdom for Tableau help with Tolerance Testing?
A regular request from Wiiisdom for Tableau users is the ability to test (assert) data against a range of values in a data warehouse. But in a production environment, data is always changing. So how can you test the data and detect anomalies?
Let’s say you have a margin of 3% today, and you know that your margin is always between 1-5%. You won’t want to signal this dashboard as containing regressions if the margin is changing within that bracket. This margin is what the tolerance testers will allow; the total allowable error within an item. The data is updated on a daily basis and the calculation of the margin is done in the visualization, not in the database. Therefore, you don’t want the test to fail as long as the value moves between this range of 1 and 5%.
Testing this tolerance is possible in Wiiisdom for Tableau using formulas in Assert Data Rules. In the dashboard below, the number of new customers today is 59.
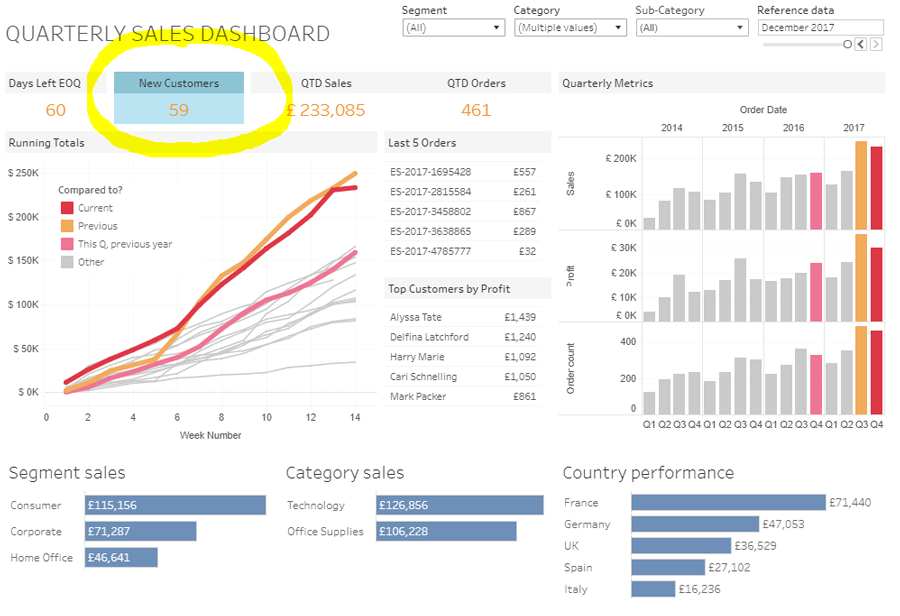
Using the formula below, Wiiisdom for Tableau will test if the value is above 50 and under 70.
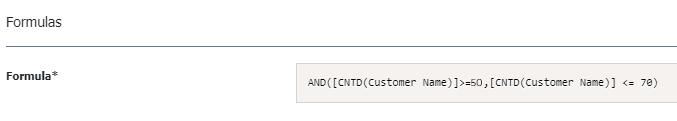
If the test fails at any time, users will be notified that the data in their dashboard has fallen outside its set threshold.
Tolerance testing is especially good when you want to continuously monitor your dashboards to track errors before the users. This kind of test would be applicable of course during development (validating business rules) but even more in production as a regular monitoring task.
How Tolerant Are You?
Tolerance testing will avoid the risk of business users consuming and presenting dashboards with the wrong data, and therefore reduce the impact of poor decision making. If you’re interested in finding out more about this type of testing for your Tableau dashboard, get in touch with us today.