Lire cet article en Français ![]()
Automate your Tableau Performance
Testing with Wiiisdom for Tableau
Performance Testing for Tableau Dashboards
Testing the performance of your Tableau dashboards is critical to ensure people have the best possible user experience. Our solution, Wiiisdom for Tableau, allows you to stress test your Tableau dashboards and measure response time and availability by driving load to your environment. It also ensures your dashboards meet the SLAs (service level agreements) at all times to meet business requirements. This article will explain how to perform performance testing in Wiiisdom for Tableau and some of the most common use cases.
Tableau Performance Testing in Wiiisdom for Tableau
Stress testing your Tableau dashboards using Wiiisdom for Tableau drives load to your Tableau server and assesses response time and availability. Unlike conventional load testing solutions that are limited in adding load at the entrance of an application, Wiiisdom for Tableau is able to add load and benchmark performances within a dashboard. It provides indications of bottlenecks and helps understand issues to fix them. Wiiisdom for Tableau allows you to simulate users and the loads they create. The events used to run the dashboard are measured from logging in to interacting and closing the dashboard.
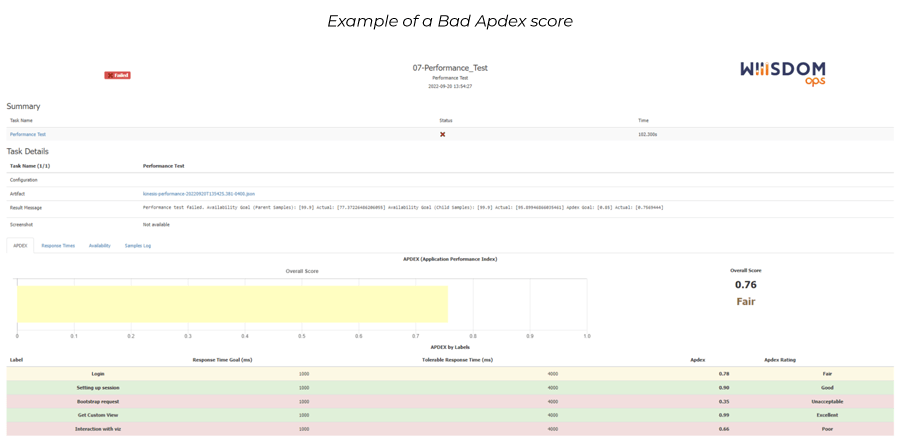
To measure the performance of your Tableau dashboards, Wiiisdom for Tableau also allows you to monitor the dashboard performance and provide a performance KPI to measure it over time, also known as the Apdex Score.
Implementing a Performance Test in Wiiisdom for Tableau
Performance testing in Wiiisdom for Tableau is straightforward to set up. Wiiisdom Ops Designer lets you choose the visualization you’d like to test as well as the duration and the number of concurrent users. Then, you need to set your goals:
- Acceptable Performance response time
- Availability goal: this is your minimum availability acceptance, by default in Wiiisdom for Tableau, it’s 99.5% (total number of successful responses from Tableau Server compared to the total number of requests)
- Apdex score: by default in Wiiisdom for Tableau, this is 0.85
Once the execution of the test is completed, Wiiisdom for Tableau provides a full report for each view tested with multiple sections:
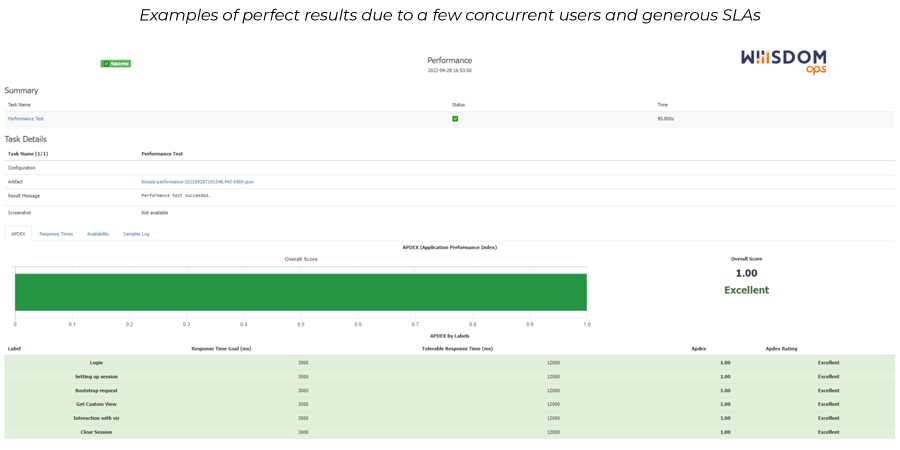
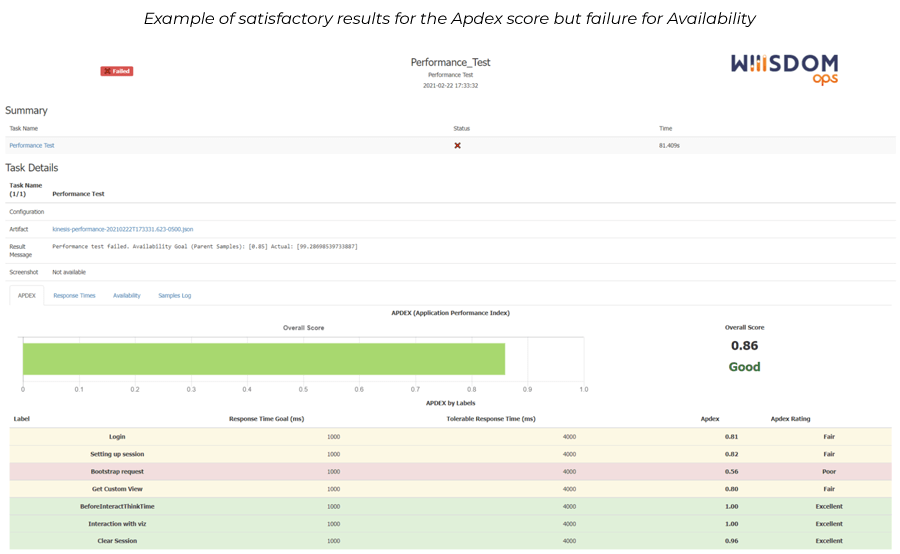
- Apdex: provides an overall score and then a score for each individual event
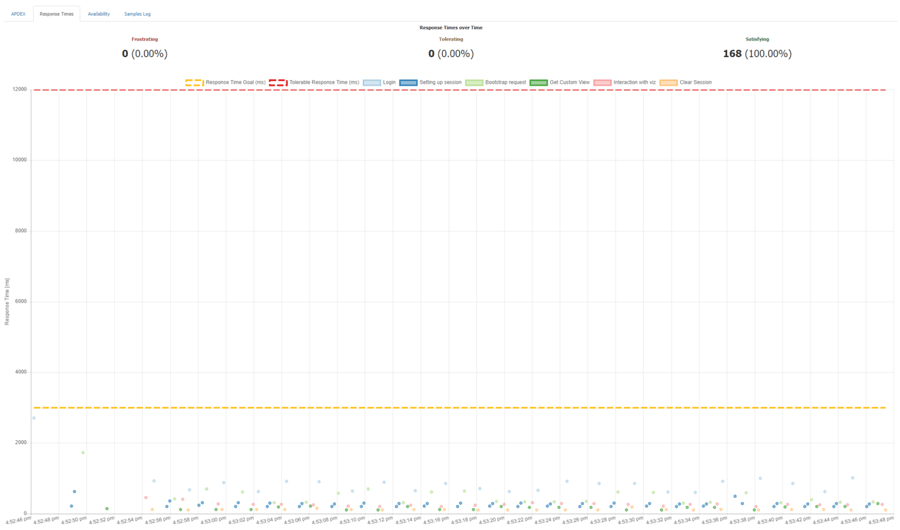
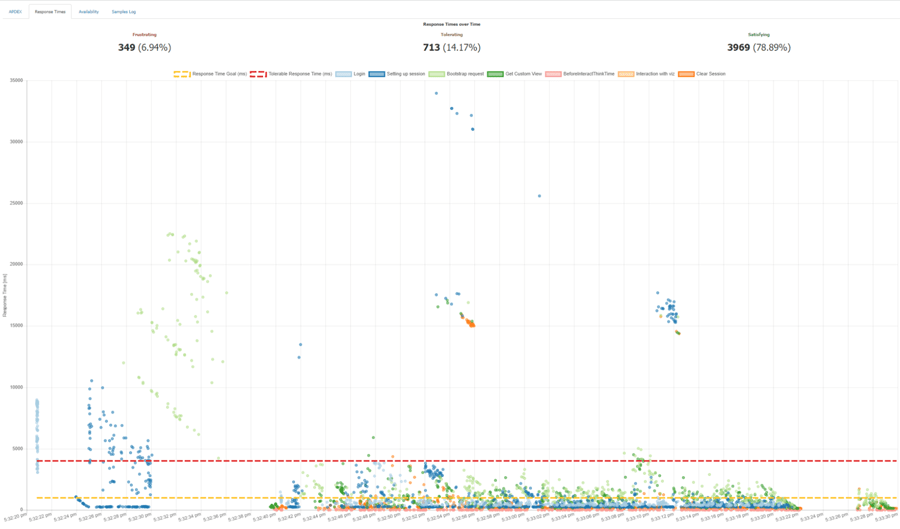
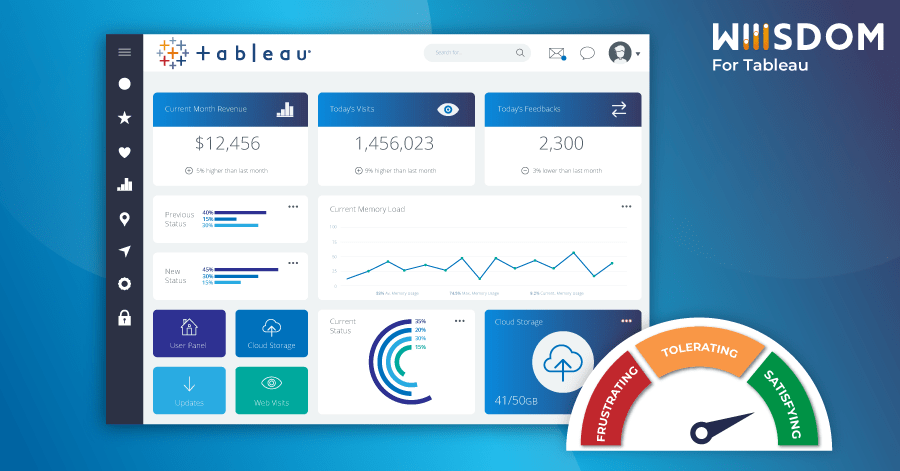
- Response time: shows the different levels of response, eg, frustrating, tolerating, satisfying
- Availability: finds any unsuccessful API response from Tableau Server. The performance test measures any API response that is not code 200 “OK” from the Tableau Server/Cloud. You can have code 429 which means “too many requests” or code 500 “internal server error”
- Sample log: displays all the measures Wiiisdom for Tableau took for performance testing
NB: To further automate the process, you can configure a notification system, using Slack for example.
Once set up, those tests can of course be reused on a regular basis to ensure proper monitoring of performances over time. The scheduling of those tests can be executed by an external scheduler (for example, Windows Task Scheduler, Cron, Jenkins, etc).
Tableau Performance Testing Use Cases
Here are some of the most common use cases our customers are leveraging Wiiisdom for Tableau performance testing for:
Anticipate Performance Issues
“I’m presenting a dashboard to a client and I need to make sure it refreshes quickly. This customer pays me more than $1000 a day and I can’t afford to not have access to data quickly and have a dashboard that doesn’t filter properly.”
As a user, there is nothing more frustrating than waiting forever for a dashboard to load to access the data that matters to them. Although it may be slower due to a poorly designed dashboard, it might also be slow because Tableau Server is underperforming. Stress testing with Wiiisdom for Tableau would identify this. Slow performance is generally the number one complaint among users. You can discover the basics of Tableau dashboard performance in our blog.
Ensure A Successful Upgrade Or Migration
“My company just updated its Tableau version and the platform was definitely faster before.”
Changes happen over time so you may need to update your Tableau version, your datasources, or even the OS server and architecture and these changes might have an impact (positive or negative) on your end user’s experience. In order to switch from a user’s mentality of ‘it was faster before’ to real metrics (e.g. time to open a view), measuring your Tableau dashboard performance and comparing it over time is critical.
Ensure SLA Requirements are met
“The dashboards need to open within 5 seconds in order to abide by the SLAs put in place.”
Dashboard validations are not only about data quality, usability, and availability. For future dashboards, before they go live, one of the quality criteria should be that they meet the company’s SLAs, if not the developers and data analysts should review the way they manage and present data.
Enhance Lifecycle Management
“I can’t risk delivering a new version of a dashboard to production without making sure every element has been thoroughly tested.”
Performance testing should be part of your CI/CD pipeline so that you can be sure that any dashboard pushed to production has been fully tested and the quality is of the highest standard. Whenever a new dashboard is designed, it’s important that you exchange with the business about performance SLAs and testing scenarios to properly leverage the CI/CD framework. Ensure dashboards are designed to only extract necessary data from your data source because the more you extract the more time it takes. This needs to be a design criterion and is a best practice when it comes to performance testing.
Ensure Optimal Embedded Analytics
“All the retail stores in my territory close at the same time and employees will access their Tableau dashboards to see the performances of the day at the same time.”
Tableau performance testing will ensure your platform can handle the sudden load of users in real-life conditions so that you can maintain the best user experience possible.
The Win of Wiiisdom for Tableau
Wiiisdom for Tableau performance testing ensures an optimal user experience by simulating user activity and peaks so that people can access their dashboards in a timely manner defined by an SLA. Ultimately, Tableau performance testing ensures SLAs are monitored and documented which in time needs to become part of a company’s culture. If you’re interested in putting performance testing in place for your Tableau dashboards, book a quick call with one of our experts.


