Lire cet article en Français ![]()
The Basics of
Tableau Dashboard Performance

What does Tableau Dashboard Performance mean?
Tableau dashboard performance refers to speed, flexibility, and simplicity for users. For example, is the dashboard working in a timely manner? A dashboard should preferably open in under six seconds, however, this could be argued depending on different job roles. A dashboard presented to the public and/or by CEOs should be less than five seconds because of its importance, yet internal dashboards could have more leeway. In this article, you will discover what you need to know when it comes to the performance of your Tableau dashboards.
What Impacts Dashboard Performance?
There are several reasons why your Tableau dashboard performance could be impacted:
1. Poor design
Too many charts in a dashboard at once will affect the performance, so it’s important to choose the right chart to present the data.
2. Slow Database
A slow database will only mean your Tableau platform will be slow as well, so make sure your database only includes the important data.
3. Slow Tableau Desktop
If Tableau Desktop is slow, this will also lead to Tableau Server performing slowly.
4. Less is more
Only work with the data and the content that the user really needs. More data will simply slow your deployment down.
What’s important to remember is that there is no perfect recipe for optimal Tableau dashboard performance; it’s simply a matter of practice makes perfect. The next section will provide you with a framework to guide you when designing your dashboards.
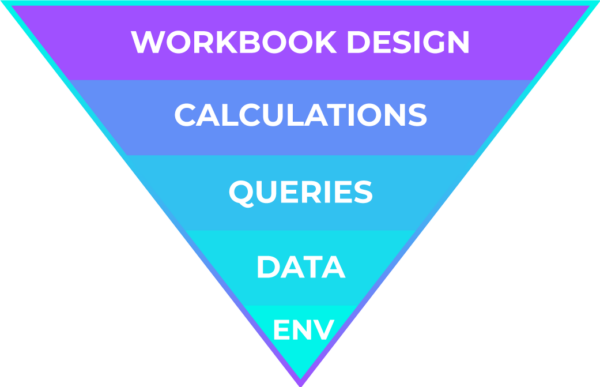
The Performance Principles Pyramid

Source: https://www.tableau.com/learn/webinars/dashboard-performance-best-practices
When looking at Tableau dashboard performance, it’s important to take into account the Performance Principles framework and understand each level of the pyramid:
Workbook Design
The most common reason behind poor performance and the easiest to change is the visual design (both at the dashboard and worksheet level). Here the layout is particularly crucial because too many charts will reduce the performance so you should only focus on creating charts that provide answers to your questions. Rendering also affects the dashboard performance as some charts are just simpler to display than others, for example, bar and line charts are easier to render than maps.
Calculations
The second is Calculations and Filters. Filters are a very important feature that allows you to create rich dashboards for your end users. However, each filter requires a query so too many cause your dashboard to take a long time to render.
Calculations are used when your data doesn’t provide all the information you need, you need to create calculated fields to help with your analysis. Remember that the more complex the calculation is, the more impact it will have on your Tableau dashboard performance.
Data
Data refers to the data sources and data connections; this is one of the most important factors of dashboard performance. If the data has to travel to reach your dashboard, then you need to account for the travel time as well, which could have a possible impact on performance.
Ask yourself questions such as: Where is your data stored? How consolidated is your data? The performance will be better if all your data is in the same place. Remember a slow database means a slow Tableau Desktop and therefore a slow Tableau Server.
Environment
Lastly, hardware configuration or capacity elements in your Tableau environment will also be contributing factors to performance.
How To Ensure Optimal Dashboard Performance
To ensure optimal Tableau dashboard performance, there are 4 factors you should consider:
- Only include what is actually needed in a dashboard.
- Choose your filters wisely because inefficient filters are one of the top causes of slow performance. It’s better to filter data in the data source.
- Aggregate and consolidate as much of your data as possible so that your data is in the same place as much as possible.
- Run tests when designing your dashboards to make sure it doesn’t exceed the acceptable response time and automate testing in production to ensure its performance over time.
How’s your Tableau dashboard performance?
This article has given you the basics to understand more about the performance of your Tableau dashboards. If you’d like to dig deeper into this topic, we have performance-testing solutions for your Tableau dashboards.

