Lire cet article en Français ![]()
Empowering Executive Decision-Making:
A Dive into Dynamic Business Tableau
Dashboards and Testing Automation
How to build dynamic dashboards—and ensure they always work
“Are you struggling to create dynamic and impactful executive dashboards?”
“Do your executives trust your dashboards?”
“Do your dashboards often break in production?”
I’m sure these questions crop up more often than not! To help us navigate these challenges, I had the pleasure and honor of co-hosting a webinar with Will Perkins, an executive director at JP Morgan Chase who leads a global team of solution engineers. He is also a Tableau Ambassador and advocates connecting, inspiring, and motivating individuals within and outside his organization through his work on Tableau Public or by sharing his best practices through webinars and blogs.
In this blog, you will learn how to create dynamic and impactful executive Tableau dashboards and test, validate, and certify them to increase trust and reduce risk exposure before sharing them with your executives.
Tips & Tricks for Creating Dynamic Executive Dashboards
To help us better understand how to create a dynamic executive dashboard, let’s take the example of Will’s Tableau Public Profile dashboard called Superstore BYOD- Datastructure.
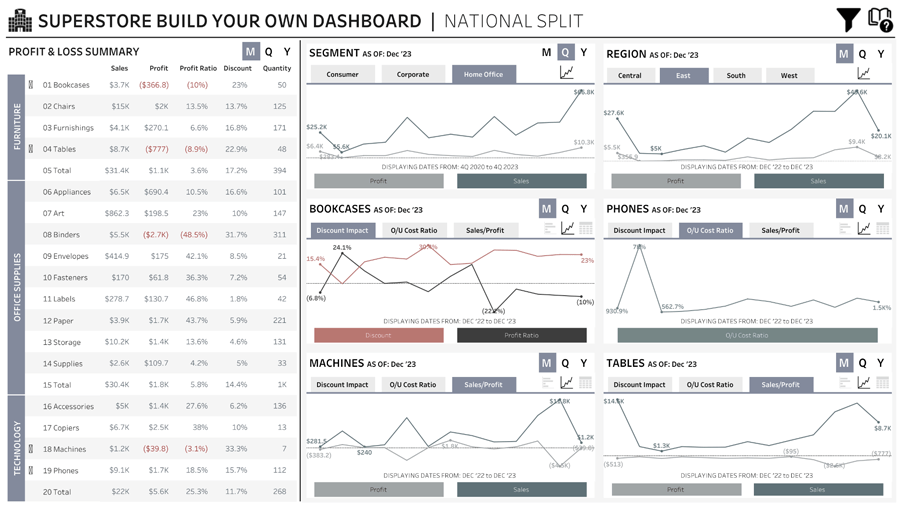
Will created this dynamic dashboard as it was a request from a CFO who wanted a dashboard with cross-tab and dynamic charts and have a monthly, quarterly and yearly view.
Here are some of the best practices to keep in mind when you are working on dynamic dashboards like this:
Firstly break down the request.
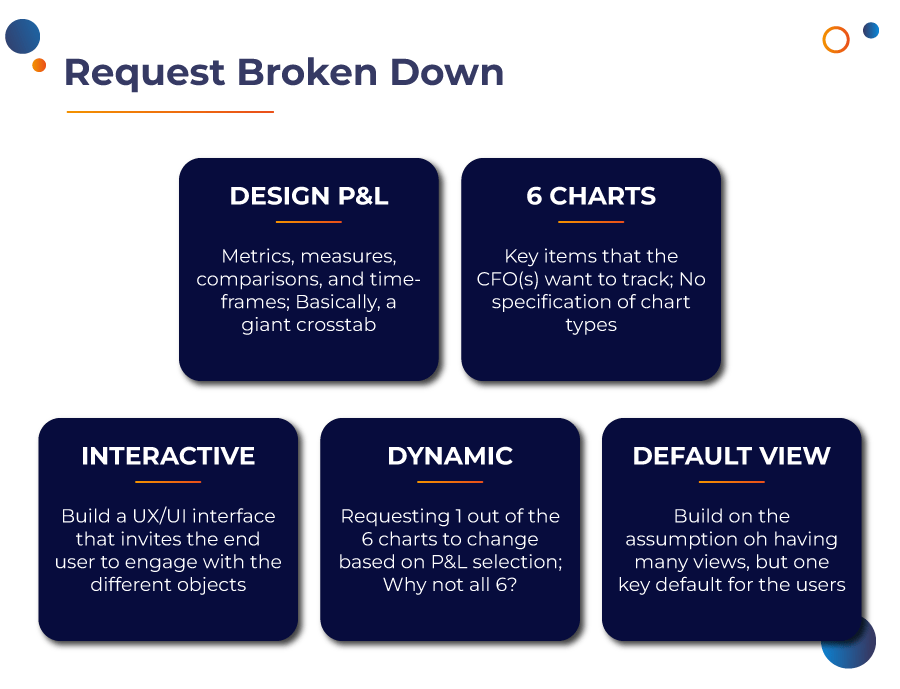
Before jumping into Tableau, take a step back and start with a reference to the existing dashboard which the executive is using and identify the dimensions, measures and scenarios.
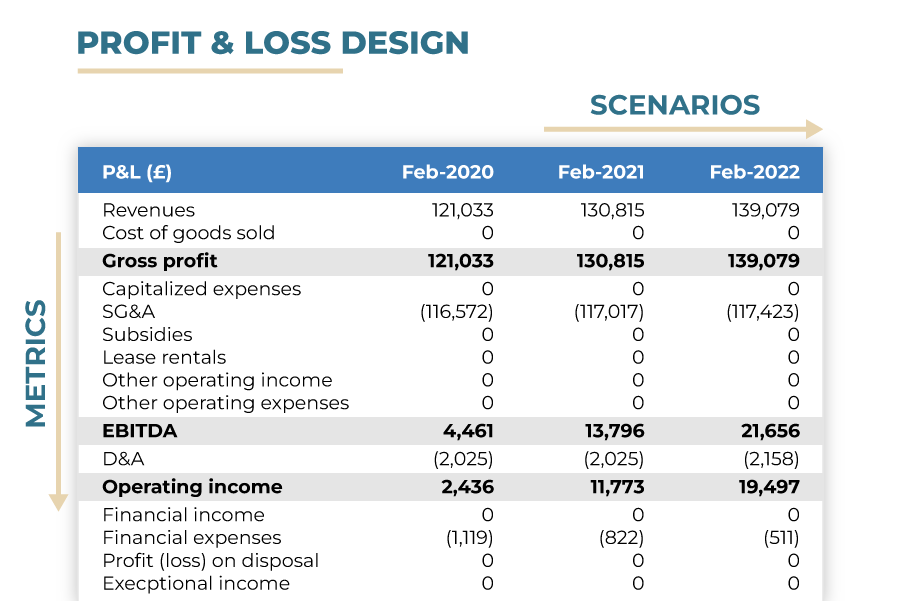
Taking the example of the P&L summary, it’s helpful to divide the design of your dashboard into what are the design elements to be started before jumping into Tableau.
Before designing in Tableau:
- Number Types: #, $, %, bps
- Decimal Points: uniform or defined by metric
- Historical data must exist to track the different timeframes
- Scenarios will have different label values that aren’t dates
- Different lines of business (LOBs) have different expectations
Keeping in mind when designing in Tableau:
- Truncations of metrics (K, MM, B, etc)
- Negative numbers: negative sign or parenthesis
- Sorting to in the correct order
- Default views that make sense to them
Sometimes, you also have to design your data source for requirements like these in which you are hardcoding your categories, sub-categories, time-frames, and charts and defining a numerical value rather than a text value.
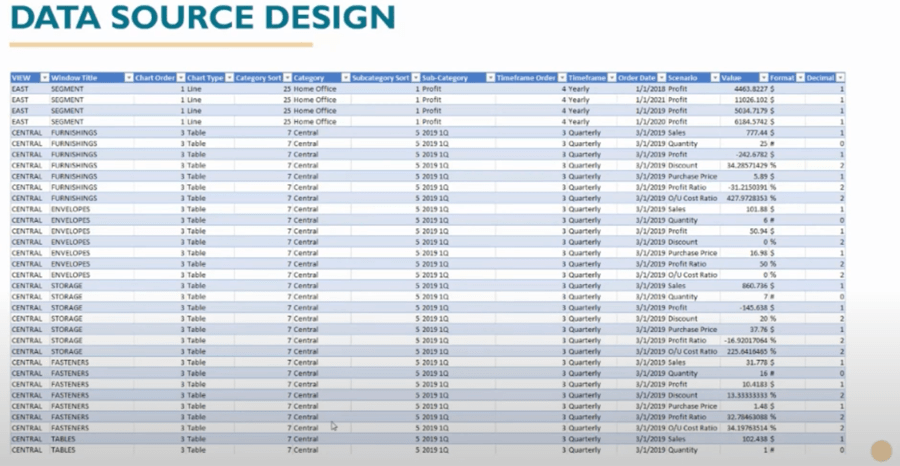
Designing the data source as you want helps you control how you can make the dashboard dynamic with a basic view of P&L on the left and six different windows where they can select based on what the executive wants to analyze.
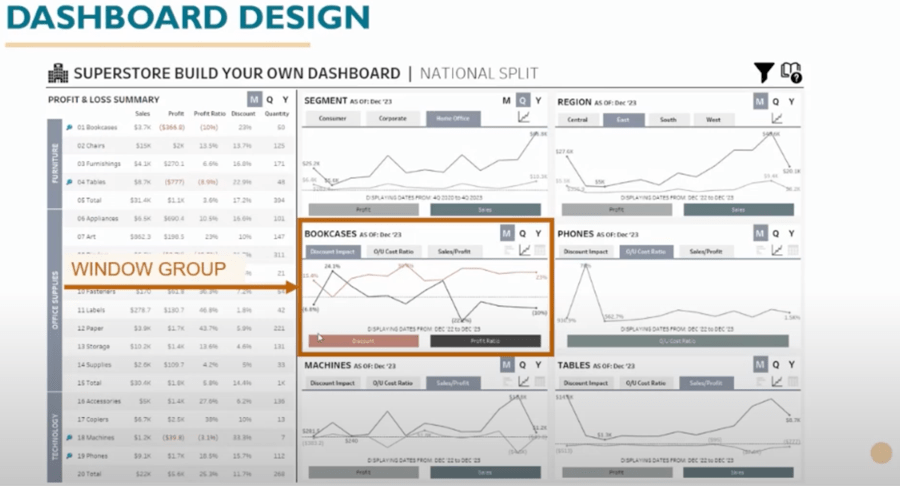
Weighing the pros and cons of creating dynamic executive dashboards
Will also shared some of the pros and cons of designing such dynamic executive dashboards:
Each “Window Group” needs nine of the worksheets to work
Pros: Owning 100% of the layout, structure, and design
Cons: A lot of updates potentially if changes need to occur
Predefined chart types and options
Pros: Letting end users find their stories
Cons: “Breaks” if new chart type is added or misspelling occurs
Switching views resets default parameters per view
Pros: Letting each business define their default views
Cons: Not everyone realizes the flexibility and they don’t keep views updated
The dashboard is truly data-driven
Pros: Allows for updating metrics, categories, etc. without impacting functionality
Cons: New colors can pop up, labels overlap, poor user experience
How can you increase trust and reduce the risk exposure of these dynamic executive dashboards?
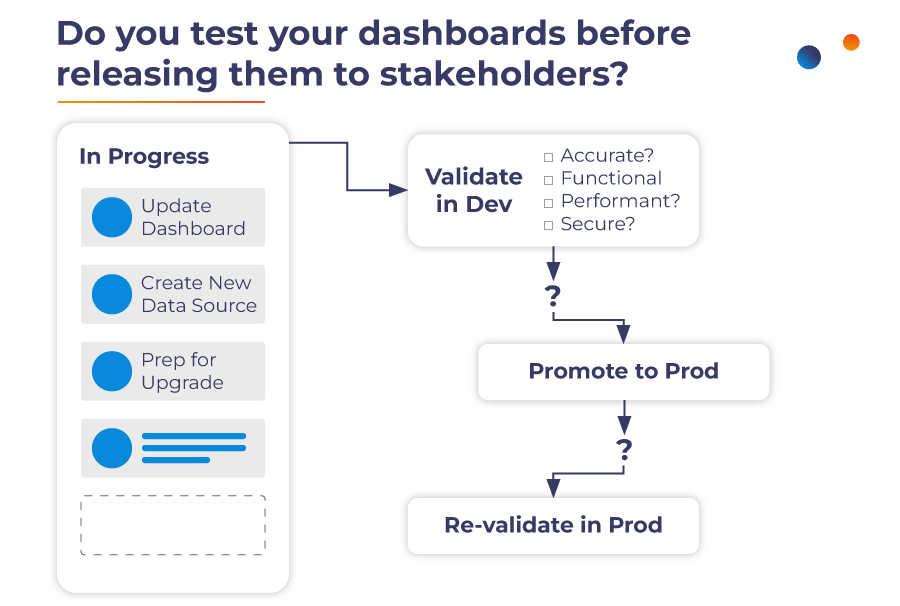
Based on the issues about unexpected values and new colors, the question I raised to Will was if he actually tested his dashboards. Even with amazing dashboards like Will’s, issues can still arise and it’s challenging to catch all errors in development and proactively in production. So, what is the solution? This is where I want to introduce Wiiisdom for Tableau! A solution that allows BI leaders, such as Will, to catch all errors in development and proactively in production before they become costly mistakes for the organization.
How to test the dashboard at scale with Wiiisdom?
The key features of Wiiisdom for Tableau include comprehensive testing capabilities, no-code automation empowering anyone to ensure 100% accuracy, regression testing acceleration for catching errors proactively, and automated content promotion and certification after successful testing.
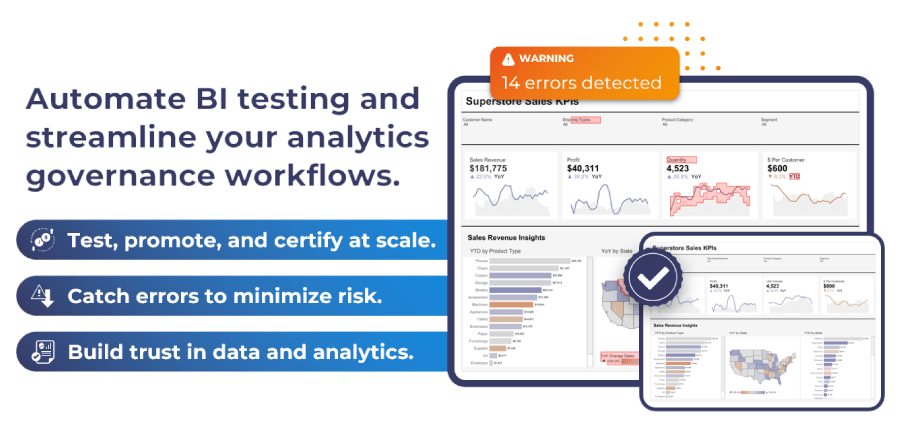
Trust You Can See
And this is where it got interesting for me, I took the challenge of testing Will’s Superstore BYOD dashboard with Wiiisdom to demonstrate how it can identify issues like unexpected values and color changes, no matter the complexity of the dashboard. This helps build trust, minimize risk, and ultimately boosts the adoption and ROI of the Tableau investment.
This was a very complex dashboard so once I got to grips with it, I spent some time understanding the dashboard created by Will and without any code was able to create functional tests in Wiiisdom which I divided into four essential parts:
- Validating filters
- Selecting summary intervals
- Validating data, and
- Interacting with complex elements
Wiiisdom helped me save days of manual testing to just a few minutes and it will proactively monitor the dashboard in the background. Just imagine if you have hundred-plus dashboards in your organization how much time Wiiisdom will save you in testing, validating, and promoting at scale.
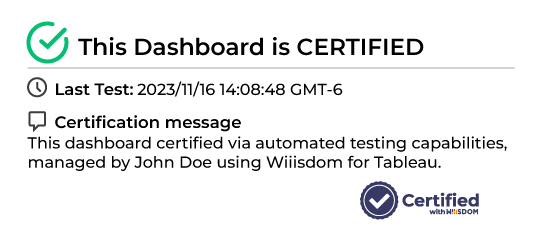
To increase trust and reduce risk exposure, now you can also certify dashboards proactively in background using Wiiisdom for Tableau. Users can enable dashboard certification ensuring that accredited dashboards are labeled accordingly. Any discrepancies or issues automatically trigger a non-certification status, alerting creators to address potential problems promptly.
Ready to automate your Tableau testing and dashboard certification?
While none of us can recover lost time spent manually testing our dashboards, there is a better way we can approach this problem. Identify an executive dashboard in your organization and let’s test, validate, promote, and certify it using Wiiisdom today.

