Business Objects Sizing

EXECUTIVE SUMMARY
Sizing–the process of determining the optimal hardware requirements, architectural design, and platform configuration for the estimated usage of a particular application–is especially challenging in the case of Business Objects (BOBJ). Sizing BOBJ is complicated because it requires a thorough understanding of the BI architecture and the BI environment–number and types of users, products, document sizes, data sources, data refresh frequency, and report scheduling. It is extremely difficult to estimate the BI environment, and sizing tools have limitations. 360Eyes is a 360Suite software solution that provides essential metadata and empowers organizations to estimate the BI environment and make sizing decisions based on FACTS rather than assumptions. 360Live and 360Cast are 360Suite software solutions that test performance to validate sizing decisions.
WHAT IS SIZING?
Sizing is the process of determining the optimal hardware requirements, architectural design, and platform configuration for the estimated usage of a particular application. Sizing is closely related to performance testing, which tests how a system performs under certain conditions, because an improperly sized system will not perform well. In the case of Business Objects, sizing generates recommendations and suggests best practices related to deploying and scaling the various BI4.X services to ensure stability, scalability, and optimal performance. The outcome of sizing may include increasing server resources to adjust CPU, memory, and storage, making architecture decisions (e.g., opting for physical and/or virtual servers) based on estimated requirements, and/or distributing BOBJ components across multiple servers.
WHEN AND WHY SHOULD BUSINESS OBJECTS BE SIZED?
Business Intelligence is resource intensive because it involves extracting information from large data sets. Different versions of BOBJ have different hardware requirements, and newer versions are designed for modern architecture (e.g., 64-bit). Every time an organization upgrades its BI platform, increases the number of users, schedules new documents, or otherwise places new demands on the system, it must resize to ensure adequate processing power (CPU, memory, disk, and network). SAP recommends sizing Business Objects with every significant change to the deployment or every six months.

HOW IS SIZING ACCOMPLISHED?
Sizing is not a perfect science. It’s not a one-off exercise. It’s not about the BI platform in isolation. And it’s not an easy undertaking. Sizing is complicated because it requires a thorough understanding of the BI architecture and environment in order to make critical assumptions and estimates.
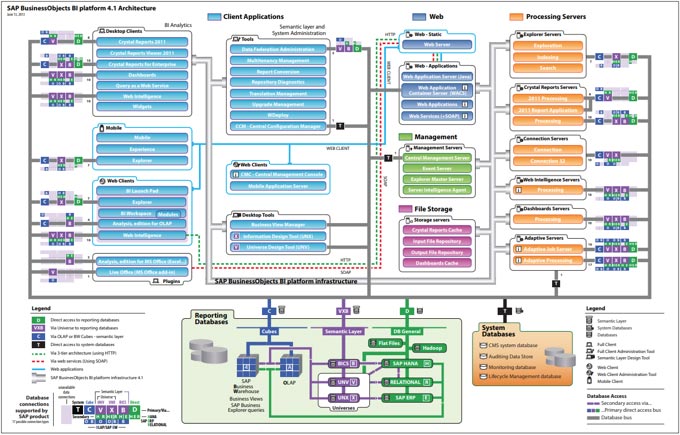
BI architecture includes: 1) BI platform (e.g., Business Objects); 2) CMS; 3) core services, like the file repository (FRS); 4) application processing services (APS); 5) non-APS services; 6) unique BI services, like Web Intelligence (WebI) and Crystal Reports; 7) web layer (e.g., Apache Tomcat); and 8) database layer (for repository and audit databases).
The BI environment includes the number and types of users, BI products, document sizes, data sources, data refresh frequency, and document scheduling
Users
The number and types of users impacts sizing. Concurrent users are people logged on to Business Objects at the same time. Active users are people generating a system load–doing something–on Business Objects. They impact the CMS and web layer (e.g., Tomcat). Active concurrent users are therefore people logged on and generating a system load on Business Objects at the same time. They impact the CMS and web layer, as well as the remaining services (e.g., WebI processing servers, job servers, connection server, etc.). When it’s not possible to take actual measurements, SAP recommends estimating that 10% of all users are concurrent, and 10% of all concurrent users are active. So 10,000 users becomes 100 active, concurrent users. But all active concurrent users are not created equal, and their impact on a platform varies by user type. For example, information consumers are users that generally view static content and thus generate very little system load. Business users may do some drilling and filtering, which generates moderate system load. Power or expert users are likely to perform resource-intensive operations and generate a heavy system load. So the 10%-rule is a poor substitute for more informed estimates.
Products, Document Sizes, and Data Sources
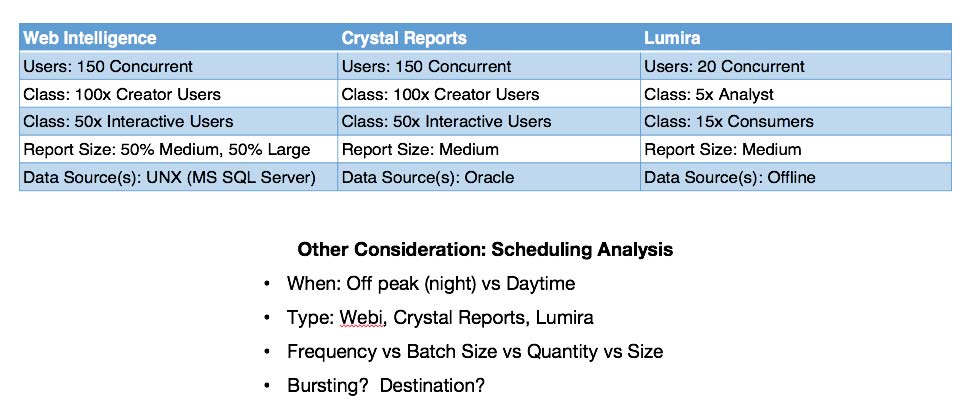
Different BI tools or products (e.g., WebI, Lumira, Design Studio, Analysis for Office/OLAP, Explorer, Dashboard, Crystal Reports for Enterprise/Mobile, etc.) have different standard document sizes and different memory requirements. Document sizes and data sources also impact sizing. When it comes to sizing, standard document sizes are just a starting point, because they don’t account for relative size (e.g., variables like query size, calculations, filtering, number of rows returned, charts, etc. that also impact processing requirements).
In addition to products and document sizes, data sources impact sizing. All data sources–UNV, UNX, OLAP, BW, HANA–have a different architecture process flow, with HANA having the least impact on the server (varies by connection), OLAP and BW having the most impact on the server, and UNV and UNX falling somewhere in between. For example, in the case of WebI, documents containing data from UNX Universes and SAP BW sources require additional processing and memory resources, while documents containing data from UNV Universes do not.
Data Refresh Frequency and Report Scheduling
Finally, data refresh frequency and report scheduling impacts sizing. The more information an organization can collect about the typical workflow of BOBJ users, the more accurately it can estimate system load. Are BOBJ documents (e.g., WebI and Crystal reports) run at night, during off-peak hours, or do users refresh documents throughout the day? If the latter, how often do they refresh? What are document scheduling requirements (what, when, where, how, why)? Do users often open multiple BOBJ documents simultaneously?
Sizing is as much an art as a science. While it may be possible to quantify the BI architecture, it’s extremely difficult to accurately estimate and map out the BI environment–who (number and type of users), what (products, document sizes, data sources), when (frequency, scheduling), and how (actions by product)–and most organizations err on the side of lowballing system load. Sizing tools, like those developed by SAP, have limitations. For example, they assume one data source for each BI tool and deployment to a single, large machine. They may exclude some BI content (e.g., Lumira, Design Studio) and/or some types of data (e.g., relational, multidimensional, in-memory). And sizing tools are only as good as the data they are fed; small errors in inputs can generate large deviations in outputs. Sizing must factor in the impact of dependences: server, networks (speed and configuration), system databases, data warehouses, etc. Sizing must also take into account that BI can be “bursty” as users run documents on a schedule or at random times. For all these reasons, SAP recommends a Business Objects sizing goal of 60-65% average CPU/RAM utilization, leaving enough headroom to handle peaks. The imprecise nature of sizing also explains why it should be an ongoing activity rather than a one-time event.
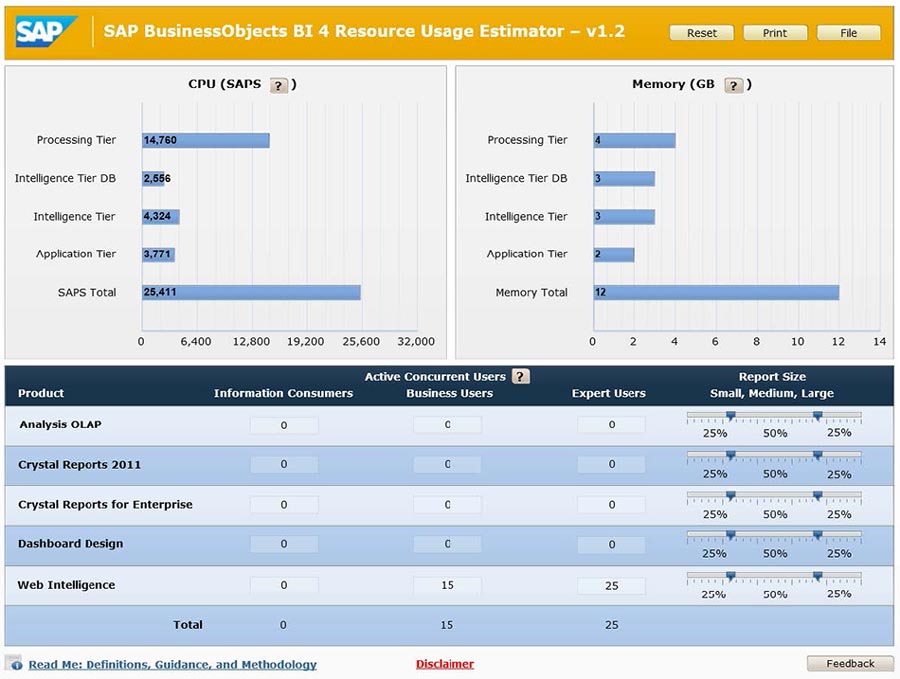
Note that the SAP resource usage estimator displays results in a hardware-independent unit of measurement called SAPS to account for the performance of different servers. As a rule of thumb, 2,000 SAPS is equal to 1 CPU/core, but the actual number varies by server.
HOW DOES SIZING IMPACT THE NUMBER AND CONFIGURATION OF SERVERS?
Sizing determines the ideal number and configuration of servers for a deployment. Small deployments may rely on a single BI server, with appropriate CPU and memory, or they may elect to have a second server for failover. Somewhat larger deployments may cluster two servers together for load balancing and failover, but both servers will be configured in the same way. Even larger deployments may install two or more servers, and configure them differently to achieve the ideal architecture. Finally, the largest deployments may choose to install four or more servers of different sizes and specifications, designed to handle specific BOBJ components. Examples include, 1) two web servers and two application servers; 2) two virtual web servers and two physical application servers; and 3) two web servers, two application servers and two Lumira servers.
HOW CAN 360SUITE HELP WITH SIZING BUSINESS OBJECTS?
360Suite is a set of software solutions that enhance Business Objects. One particular solution–360Eyes–is valuable for sizing because it allows organizations to estimate the BI environment based on FACTS rather than assumptions. 360Eyes extracts information from the audit database, including metadata from the CMS and FileStore, and provides the data needed for sizing: number and type of users, number and type of actions, BI tools in use, quantity and size of documents, data sources, and scheduling analysis.
Make sizing decisions based on FACTS rather than assumptions with 360Suite.
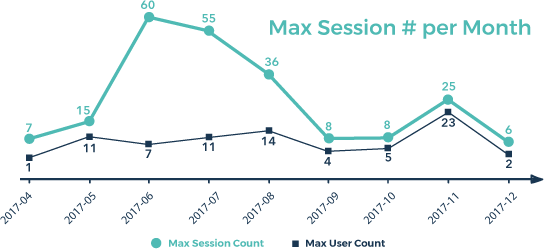
Image: Quantifying sessions and users, and identifying peaks, illustrates the ratio based on real usage by user type–power users (experts), consumers (business users), and SAC (information users).
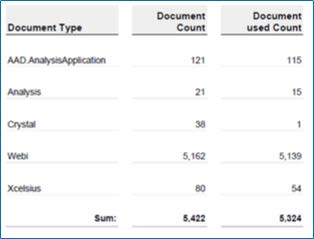
Image: Quantifying usage by document type provides critical insight. For example, in this case, only 1 of 38 Crystal reports is actually being used.
360Suite also allows users to make sizing decisions based on TRENDS rather than assumptions.
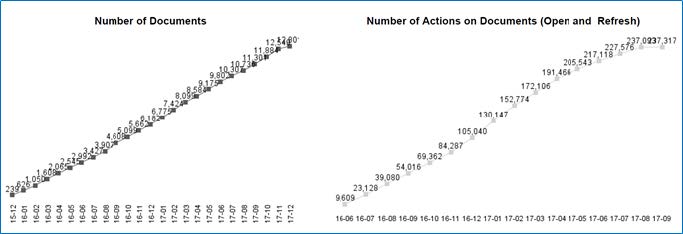
Image: The growing number of documents (left) is an interesting trend. But the growing number of actions on documents (right) is the only trend that really matters. When it comes to sizing, it’s actual document usage–and not the total number of documents–that counts.
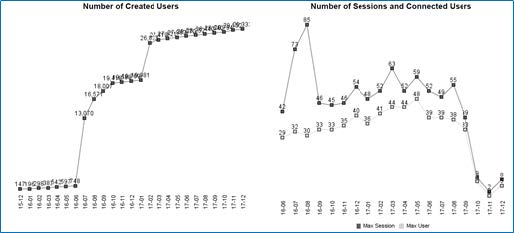
Image: The growing number of created users (left) is a trend that suggests the need to size up. But actual usage (right) is trending in the opposite direction, suggesting the need to size down. In this case, 360Eyes insight has the potential to generate substantial cost savings.
Two other tools–360Live and 360Cast–can be used to test performance and validate sizing decisions. Sizing and performance testing go hand-in-hand. When performance testing indicates that Business Objects is falling short of expectations, organizations can undertake a sizing exercise. When sizing exercises result in changes to hardware, server number, or configuration, performance testing ensures that sizing decisions got to the heart of the problem.
Overinvesting in hardware wastes money. Underinvesting compromises performance and user satisfaction. Sizing Business Objects based on 360Suite metadata is the professional way to fine-tune hardware requirements and resource allocation. 360Suite also generates a byproduct that is less quantifiable but no less important. It creates a symbiosis between IT and business by aligning their goals–an optimal end-user experience at the lowest possible cost.
360Suite is a suite of agile governance solutions for SAP BusinessObjects developed by Wiiisdom.
At Wiiisdom, we transform your Analytics landscape into a reliable place to make better, trusted decisions every day and maximize your data assets.
360Suite is a set of solutions to ensure quality, reliability, performance, and efficiency of SAP BusinessObjects through testing, auditing, monitoring, cataloging, and scheduling methodologies. 360Suite is designed for large organizations looking to mitigate data risks, automate operations, and is the solution of choice for any migration project.
Resources:
360Suite Sizing Webinar:
https://www.youtube.com/watch?v=VR8KEOcvDGM&feature=youtu.be
Author: Patrick Perrier ![]()