Lire livre blanc en Français ![]()
An Introduction To AnalyticsOps
And Its Role In The Data Journey
Executive Summary
Today, companies tend to be data-driven. However, business executives consume dashboards, and rarely the raw data.
Data is ubiquitous, its quantity is growing exponentially. A few years ago, the need to extract, consolidate, enrich and test data led to the emergence of DataOps (“Data Operations”) to address data governance issues. DataOps has inherited the so-called “agile” methodologies that have proven their worth in the reliability of software development, well known as DevOps.
These days, while the costly task of data governance seems to be finalized or in the process of being finalized, trust in Analytics is still lacking.
During this time, Analytics has taken a critical place within companies, even for those producing financial reports or regulatory reporting. Strategic decisions are made by boards and management committees based on these dashboards.
With the rise of APIs and automation, KPIs from dashboards drive and influence the behavior of algorithms. What happens if your company publishes wrong KPIs, which can feed, for example, automated trading algorithms? Your company will be held liable, not to mention the negative impact on your brand reputation.
So what’s the problem? Let’s be completely honest: dashboards are simply not tested. It’s like testing each individual part of an airplane but never testing the plane once it’s assembled. A perilous approach, you will agree.
AnalyticsOps is a framework that prioritizes the development of automation and the consumption of analytics across a whole organization. It helps break siloes by bringing together data science, analytics teams, and the rest of the business through integrating, testing, deploying, monitoring, and adapting analytics in order to continually drive value to the business.
This white paper will discuss the role and importance of AnalyticsOps for organizations to have confidence in the decisions they make.
Introduction To Data and Analytics In Today’s World
Data is everywhere. It’s not something we can physically touch but data is around us all the time. The use and importance of data are forever increasing, meaning more analytics thus more competition in the market. $25.5 billion were invested in Analytics in 20201 making it the top spend in IT. Moreover, according to a recent survey2, knowledge workers spend more than five hours a day in analytics and 99% of them consider analytics essential when making business-critical decisions. However, this increased use of analytics for decision-makers still raises one big problem: analytics trust. Having one single version of the truth is Analytics leaders’ holy grail but many have failed to achieve it, with four out of five CEOs not trusting the data upon which they base their decisions3. Other barriers such as a fragmented market resulting in low adoption also add to the problem of analytics trust.
At Wiiisdom, we believe that people should be able to make trusted decisions at all times when using analytics. For this to work, organizations need agile governance solutions such as AnalyticsOps solutions to tackle this problem of trust.
Analytics Quality: A Business Problem
Modern analytics allows users to use and consume analytics freely with their own data sources and in some use cases, without any input from IT. Allowing for freedom and employee empowerment are essential for innovation, but letting BI analysts create new analytics can create chaos with an organization. It increases the risk of running out of control and Shadow IT due to a lack of top-down control of heavyweight IT processes.
Given the increase of modern analytics, finding the right balance between governance and self-service analytics is a key success factor. By its very nature, Analytics constantly evolve over time to keep up with changes in the market and user demands. Therefore, managers need to understand that anyone must be able to do self-service analytics in order to keep up with these growing market conditions. Creating trust brings higher usage and transforms companies into data-driven organizations. It also builds a data culture which is an important factor for successful self-service analytics; nonetheless, a challenge in itself because it requires collaboration from everyone in an organization.
The Multi-BI Reality
In an ideal world, organizations would use one single enterprise BI and Analytics (BIA) platform but the reality is far from that. The analytics market is highly fragmented due to the highly competitive field of analytics vendors, each continually innovating and adding more capabilities for their customers. It is extremely difficult for one platform to cover all the needs of an organization, plus with mergers, acquisitions, and poor alignments between technology and business it’s near impossible for organizations to avoid using several BIA platforms.
According to Forrester4, organizations use on average five BI and Analytics solutions, (this includes embedded analytics). In 2020, we conducted a survey and interviewed over 800 BIA professionals who recognized that multi-BI is the reality and is here to stay, with 3.8 BIA platforms on average deployed per organization. BIA professionals, organizations, and analytics vendors need to face up to this reality and understand there is this missing link for, as Forrester defines it, “BI Fabric Technologies” — technologies that integrate BI components from multiple BI solutions.
Understanding Data Governance and DataOps
Before users are able to consume analytics on their dashboards and reports, there are various stages by which data moves from collection to use. This is called the Data Journey5. Every stage of the Data Journey impacts the following one, with the final impact being on the Data Analytics layer. During the Data Governance lifecycle stage, data engineers are responsible for creating data sets for analysts to integrate, which if done manually are very labor-intensive and error-prone. Thanks to DataOps technologies, data engineers are able to streamline the quality control, orchestration, and data operations aspects of their duties. This is achieved by automating tasks for agile development and testing/monitoring the data pipeline. DataOps focuses on a process-oriented methodology used by data teams to improve the quality of data analytics.
Ensure trust at all times throughout the Data Journey.
However, a problem still remains in the last mile of the journey: Data Analytics. The Data Management and Data Governance stages are monitored and tested, but how can the end-user be assured that the analytics they are consuming are governed and trusted? Nobody takes business decisions from data sets or raw data, they are made from dashboards and reports and data governance only secures a subset of the Data Journey. Analytics is forever changing and end-users need to be able to trust their analytics, just as much as data engineers and analysts at the beginning of the data journey.
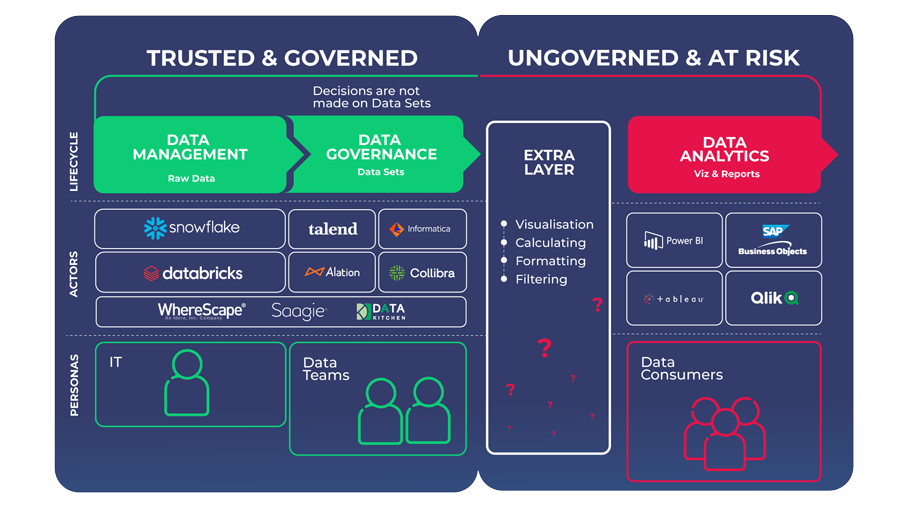
Organizations need to ensure trusted data and analytics throughout the entire Data Journey.
The Trend Of Automation
It is clear that an increase of data leads to more data analytics and thus higher usage, requiring more testing and development to ensure data trust. To handle this heavier workload and tackle the problem of trust, organizations need to automate this process.
As a result of automation, data can be ready for people to consume much more quickly because the previous mundane IT tasks can be done automatically in a shorter amount of time. As Matt Turck explains in his recent 2021 MAD Landscape overview, people have been talking about automation for the past three years because it turns “analog companies that run on sending Excel spreadsheets around with a lot of manual processes, into companies that are intelligent and automated and run on data.6” This means organizations can easily adapt and react to the data presented. It is becoming the real superpower that enables data-driven decision-making.
Introducing AnalyticsOps
DataOps ensures the beginning of the data journey to be trusted and governed, yet the last mile in the journey, Data Analytics, is still at risk.
AnalyticsOps is a combination of methodologies (inspired from DevOps and DataOps7) and tools to fasten time-to-value, decrease manual-generated risks, and make operations scalable and efficient. Data Analytics is the last mile in the data journey, thus closer to the masses, and so finding agile ways to ensure trusted and governed data is essential. Performing data analytics today requires automation to be able to validate and analyze the quality of the data. This helps in detecting any anomalies that increase the risk of making poor business decisions. The AnalyticsOps framework aims to break siloes and unite data science, analytics teams, and the business.
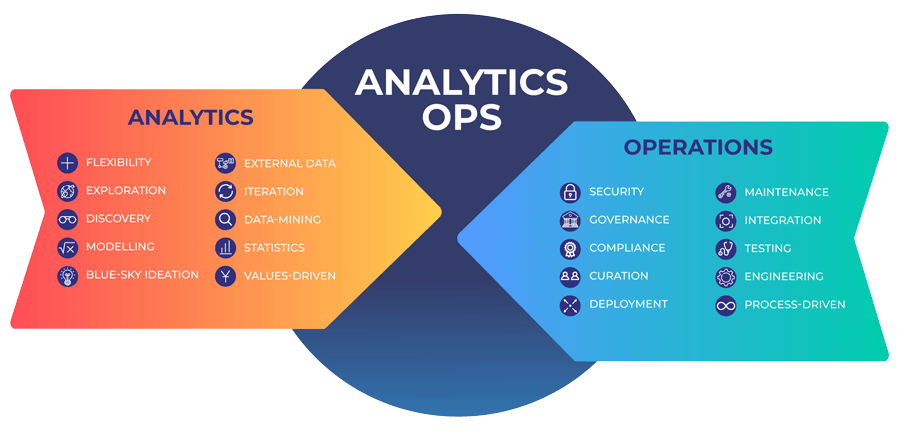
The different components of AnalyticsOps8.
Defining Analytics Governance
With the vast amount of data being handled every day, organizations need a discipline to ensure effective and efficient implementation and deployment of their data. Like Data Governance, which establishes data security and quality, Analytics Governance applies the same level of scrutiny but for how analytics projects are carried out and used.
Trust comes from common beliefs and consistency and so it’s important when following a framework for Analytics Governance to define shared rules in order to not only have a better understanding but also put everyone within an organization on the same track. For Analytics governance to be successful, rules need to be defined in order to unify IT and the business and thus combat analytics siloes. One of the biggest mistakes an organization can make when trying to improve governance is to overlook the people behind the data9. That’s why here, the role of Centers of Excellence (CoE) is crucial because they are responsible for streamlining an organization’s analytical efforts and the way analytics are presented and consumed by users.
Analytics governance is critical in the last mile of the data journey because organizations need to be sure every deployment is trustable so reliable decisions can be made.
Enhancing Agility Through Automated Testing and Deployment
We all understand that Analytics evolve and iterate quickly due to changing user demands and fast-paced markets. Today there is the need to deliver higher quality analytics more quickly and resolve issues before bad data gets consumed and impacts decision making. For businesses to work towards this goal, CI/CD (continuous integration/continuous delivery) processes need to be put in place. But, what exactly is CI/CD when applied to Analytics?
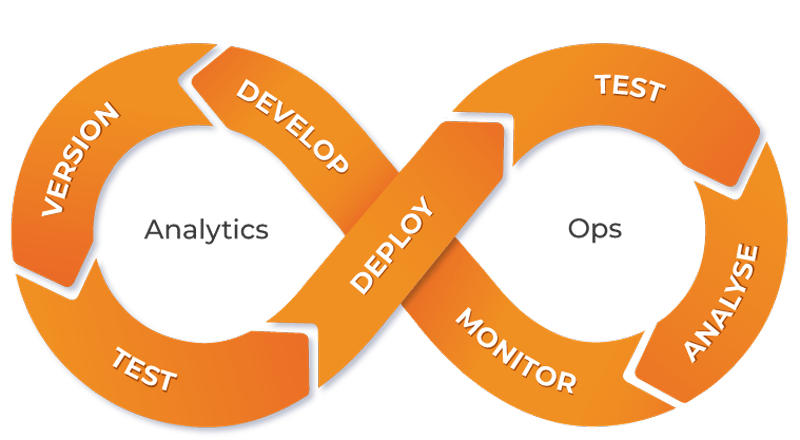
Let’s go back a step into the development cycle:
Imagine creating a dashboard to answer an important question for your company. A dashboard is developed to apply a business logic on top of various data sources in an easily understandable manner. The next step is to use a version control tool to track any changes or edits to the data. Then the dashboard is tested to verify that everything is working as expected and deployed for business users to consume. However, if users make a change to this dashboard, or if a developer applies another change, how do they know that it did not break anything within the dashboard? This is where the missing piece of the puzzle appears: CI/CD. Before any deployment, tests are run automatically to validate the data and functionality of the dashboard before it gets delivered to the customer or end-users. These tests act as an insurance policy against any critical failures.
Agile methodologies such as CI/CD provide scalability, cost reduction, transparency, and interoperability because it allows you to understand your whole data analytics lifecycle at any time and be sure that all dashboards provide the correct data through constant iteration. It takes away the problem of manual testing, high development costs, and a poor user experience. What used to be an IT process can now be implemented by Analytics team members; another way to break Analytics siloes and unify IT and the business.
Who’s Concerned By AnalyticsOps?
Three teams within an organization are concerned with AnalyticsOps:
- IT teams: they want to maintain and secure a stable infrastructure.
- Data team: they want an agile environment where their preferred tools are up-to-date to meet the requirements of the business.
- C-Levels and Lines of Business: they look for actionable insights and to reduce the risk of making bad business decisions.
IT
TEAMS
- Comply With Regulatory Requirements
- Meet SLA Constraints
- Monitor Performances
- Assert Data Quality
- Successfully Complete Your Upgrades
DATA
TEAMS
- Monitor Usage and Adoption
- Fasten Time To Value
- Implement Agile / Modern Analytics Methodologies
- Ensure Data Availability and User Satisfaction
- Understand User Behavior
C-LEVELS AND
LINES OF BUSINESS
- Mitigate the risk of taking bad decisions
- Exclude the possibility of publicly sharing bad data
- Support the development of a data-driven culture
- Enable a governed, self-service culture of Analytics
- Increase the overall value of Analytics
AnalyticsOps is not just for IT teams but for the company as a whole.
AnalyticsOps helps towards the unification of all these teams in order to break Analytics siloes and make it a company-wide effort.
Unlocking The Value of Analytics
To truly understand the value Analytics can bring to your organization, it’s important to understand what Analytics in organizations would look like without a framework such as AnalyticsOps. As Gartner reported10, the value from analytics is not realized until you reach production but the problem is that only 15% of projects actually reach production.
If Analytics is not available quickly enough to business users, their value will be lost because Analytics is an ever-changing world to be able to keep up with user demands and market changes. The overall goal of Analytics is to reach production fast. A simple look at life with and without AnalyticsOps shows you clearly why it’s critical for organizations today:
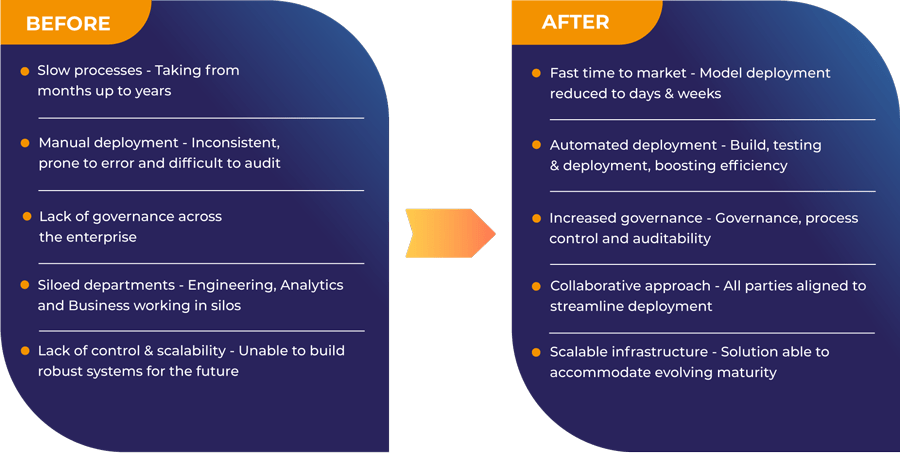
Before and After Implementing AnalyticsOps, Teradata11.
Through automated orchestration, testing and monitoring, AnalyticsOps will bring more value to your whole organization. It will no longer result in analytics siloes but rather a collaborative approach for everyone in the business. Every department will benefit from this approach:
- Executives and C-levels: better-trusted decisions, lower risks
- Business and Users: receive a better product faster
- Data System Owner: governance and clearer processes
- Data Science Teams: optimization and automation
- IT Support: reduce operational overheads
Moreover, and most importantly, AnalyticsOps provides trust and mitigates risks. More trust leads to higher usage and better and safer decisions. More trust leads to higher performance and a better user experience resulting in higher adoption and ultimately higher ROI. It’s expected that “by 2024, one-third of organizations will adopt an analytics operation approach similar to, and integrated with, their data operations processes to enhance responsiveness and agility12.” Therefore, organizations should not underestimate the importance of AnalyticsOps in adding value to their business with agile, governed, scalable, and cost-effective analytics.
AnalyticsOps Is Here To Stay
AnalyticsOps will ensure the last mile of the data journey is governed and trusted. Through agile methodologies of automated testing and monitoring, organizations can be sure they are providing their employees with reliable and easily accessible data to be able to make the best decisions on a daily basis. It is time to break analytics siloes and unify IT and the business in order for data analytics to be truly successful for all organizations.
Our Mission At Wiiisdom
Wiiisdom provides modern Analytics Governance solutions that test the data accessible in different BI reports and dashboards, measure cost and user adoption by department or project, and automate operations in order to maximize the potential of data analytics for its customers.
1. Market Share: Data and Analytics Software, Worldwide, 2020
2. 2021 State of Analytics: Why Users Demand Better
3. Trusted Analytics Matter To CEOs
4. The BI Fabric Baby Is Slowly But Surely Growing Up
5. Data Journey – What Is It?
6. 2021 MAD Landscape: The Top 10 Trends
7. DataOps: Devops Applied to Data Projects
8. AnalyticsOps: The Path To Production – Errol Koolmeister
9. What is an Analytics Center of Excellence?
10. Failure rates for analytics, AI, and big data projects = 85% – yikes!
11. AnalyticsOps: The Path To Production
12. Analytics Ops: The Last Mile Of Data Ops
References
- 2021 MAD Landscape: The Top 10 Trends – Matt Turck, 2021
- 2021 State of Analytics: Why Users Demand Better – InsightSoftware, 2021
- Analytics Ops: The Last Mile Of Data Ops – David Menninger, 2021
- AnalyticsOps: The Path To Production – Errol Koolmeister, 2018
- Build An Agile BI Organization To Support An Insights-Driven Culture – Boris Evelson, 2019
- AnalyticsOps: The Path To Production – Errol Koolmeister, 2018
- Business Intelligence Trends 2020 – Wiiisdom, 2019
- Data Culture – Tableau
- Data Journey – What Is It? – Toucan Toco
- DataOps: DevOps Applied to Data Projects – Cyrielle Chauwin, 2019
- Failure rates for analytics, AI, and big data projects = 85% – yikes! – Brian T. O’Neill, 2019
- Market Share: Data and Analytics Software, Worldwide, 2020 – Gartner, 2021
- The BI Fabric Baby Is Slowly But Surely Growing Up – Boris Evelson, 2021
- Trusted Analytics Matter To CEOs – KPMG, 2019
- What is an Analytics Center of Excellence? – Chris Sorensen, 2021